Aspen Economic Strategy Group Releases New Policy Analyses Examining the US Infrastructure Agenda

Three papers examine how infrastructure investments can promote economic growth and broader prosperity.

Washington, DC, July 14, 2021 – The Aspen Economic Strategy Group (AESG) today released a set of three papers on infrastructure and technological innovation and their impact on the post-pandemic economic recovery.  These papers will be included in the group’s annual policy volume, “Rebuilding the Post-Pandemic Economy,” which will be released in December 2021, but it was critical to release these papers now so they can help inform debate as the US infrastructure agenda evolves.  The authors of these papers, all renowned experts on the topics covered, provide important economic insights relevant to ongoing private and public sector discussions about the size and scope of infrastructure spending. 

The AESG, a diverse, bi-partisan group of distinguished economic leaders and thinkers, will convene in late July to discuss important questions about why and how to invest in American infrastructure.  How much infrastructure investment do we need and what type of infrastructure should be prioritized (roads and bridges vs. digital infrastructure)?  How do we enhance the efficiency of the current infrastructure stock? How should we think about the equity dimensions of new infrastructure investments? 

As the Senate reconvenes this week and resumes work on a bipartisan infrastructure plan, the papers provide economic analyses on which types of new infrastructure investments can be a springboard for innovation, energy efficiency, sustained competitiveness, and broader prosperity.


Economic Perspectives on Infrastructure Investment
Edward Glaeser, Fred and Eleanor Glimp Professor of Economics in the Faculty of Arts and Sciences at Harvard University
James Poterba, Mitsui Professor of Economics at MIT and the President of the National Bureau of Economic Research

As the country embarks on a major infrastructure initiative, the authors highlight relevant policy lessons from economic studies of infrastructure projects.  Key themes include: 

  • Projects vary widely in their benefits and costs, even within categories such as roads and bridges. Overall, interstate highways today are smoother, and fewer bridges are structurally deficient, than several decades ago. Careful cost-benefit analysis, perhaps carried out by a nonpartisan federal agency created for the purpose, can help identify which projects should be undertaken.
  • While many potential infrastructure projects have substantial benefits, infrastructure costs in the United States are very high by international standards.  Controlling costs by improving procurement practices and project management can raise the benefits per dollar of infrastructure spending. 
  • Maintaining existing infrastructure, rather than building new projects, is one of the most cost-effective ways to deploy new infrastructure dollars.


Challenges of a Clean Energy Transition and Implications for Energy Infrastructure Policy
Severin Borenstein, E.T. Grether Professor of Business Administration and Public Policy at the Berkeley Haas School of Business
Ryan Kellogg, Professor and Deputy Dean for Academic Programs at the University of Chicago Harris School of Public Policy

A central challenge in the transition to clean energy is the need to simultaneously control costs and ensure a reliable energy supply.  The authors present key issues the country faces in transitioning to a low-carbon energy system, and the infrastructure that will be needed to support this transition:  

  • Broad incentives – such as carbon pricing, clean energy standards, or clean energy subsidies – that do not discriminate across zero-emissions resources will be essential for directing capital towards cost-effective investments in clean energy infrastructure.
  • The climate challenge is a global challenge, and an essential way to encourage other nations to reduce their own emissions will be to invest in development of zero-emissions technologies and then export those technologies around the globe.
  • Reforms to wholesale and retail electricity markets, and to the regulatory process for long-distance transmission investment, are needed to enable a low cost energy transition that distributes its costs and benefits in an equitable way.
  • The clean energy transition must provide for decommissioning of legacy fossil fuel infrastructure, which also offers an opportunity to employ displaced oil and gas workers.


Science and Innovation: The Under-Fueled Engine of Prosperity
Benjamin Jones, Gordon and Llura Gund Family Professor of Entrepreneurship, and Professor of Strategy at the Kellogg School of Management at Northwestern University

The paper explores the central role of science and innovation in the national interest and what role the government needs to have in enacting policies that strengthen public investment.  Key findings include:  

  • The United States massively underinvests in science and innovation, with implications for our future standards of living, health, national competitiveness, and capacity to respond to crises.
  • Public R&D investment is near its lowest level in the last 60 years and doubling current funding would more than pay for itself. 
  • The social returns to R&D investment are huge: for every $1 that is invested, society reaps an average return of $5.


“As policymakers continue to shape the US infrastructure agenda, these papers provide valuable insights and recommendations about how to promote efficient and equitable investments,” said Melissa S. Kearney, AESG Director and the Neil Moskowitz Professor of Economics at University of Maryland. “Smart investments in infrastructure will advance the goals of a more robust, inclusive, and resilient nation.”  

The Aspen Economic Strategy Group (AESG), a program of the Aspen Institute, is composed of a diverse, bipartisan group of distinguished leaders and thinkers with the goal of promoting evidence-based solutions to significant US economic challenges. Co-chaired by Henry M. Paulson, Jr. and Erskine Bowles, the AESG fosters the exchange of economic policy ideas and seeks to clarify the lines of debate on emerging economic issues while promoting bipartisan relationship-building among current and future generations of policy leaders in Washington. More information can be found at https://economicstrategygroup.org/.

The Aspen Institute is a global nonprofit organization committed to realizing a free, just, and equitable society. Founded in 1949, the Institute drives change through dialogue, leadership, and action to help solve the most important challenges facing the United States and the world. Headquartered in Washington, DC, the Institute has a campus in Aspen, Colorado, and an international network of partners. For more information, visit www.aspeninstitute.org.


Contact:
Suzanne Pinto
Suzanne.Pinto@argos-communications.com

Challenges of a Clean Energy Transition and Implications for Energy Infrastructure Policy

Economists Severin Borenstein (Berkeley Haas School of Business) and Ryan Kellogg (University of Chicago Harris School of Public Policy) discuss the major barriers that need to be overcome in order to successfully execute a transition to a reliable low-carbon energy system at reasonable cost. The authors observe that the country must rapidly reduce greenhouse gas (GHG) emissions while maintaining energy affordability, reliability, and resilience, and address the historical socioeconomic and racial disparities in both access to energy consumption and harm from energy production.

Their report offers a number of concrete suggestions for an energy infrastructure policy agenda, in addition to broad clean energy production incentives:

  • Invest in research, development, and early-stage deployment of novel technologies.
  • Improve the design and price transparency of wholesale power markets.
  • Enhance federal authority over long-distance transmission siting.
  • Reform retail electricity rates to more accurately reflect society’s full marginal cost.
  • Address local pollution and involve local communities.
  • Ensure funding for infrastructure decommissioning.

THE CORE CHALLENGE
Unlike fossil fuels, which provide cheap, reliable sources of energy that can be stored and transported, wind and solar generation are intermittent, costly to store, and are not dispatchable. Providing reliable, zero-carbon emission supply will require combining wind and solar resources with investments in dispatchable zero-emission sources (such as nuclear or hydroelectric sources), long-distance transmission, demand flexibility, and storage technologies. Doing so will require large, policy-driven investments in new energy infrastructure for generation, transmission, storage, and distribution of zero-emission power. A central policy challenge is how to catalyze the necessary investments without unduly increasing costs to end-users.

LOW CARBON TECHNOLOGIES
Reducing costs of nuclear power and developing and scaling carbon capture and sequestration technology would make significant strides toward achieving a zero-carbon economy. In the near-term, the primary pathway for providing clean energy is electrification. Thus, over at least the next decade, widespread use of intermittent renewables—wind and solar power—will be necessary. However, wind and solar alone cannot support a stable electricity system because their production pattern is determined by nature.

The authors argue that a combination of four different approaches could maintain grid stability in a system with very high levels of intermittent generation: long-distance power transmission, storage, demand flexibility, and dispatchable generation. However, they acknowledge that each of these four approaches has its own challenges:

  • Transmission: Electricity transmission is critical for taking electricity from its point of generation from sun and wind and moving it to population centers. Transmission also connects energy markets, which enhances competition among electricity generators. More market options mean less need to curtail renewable production if the output of a given facility exceeds the needs of nearby customers, which then implies higher capacity utilization and lower cost per kilowatt-hour. The cost of transmission is substantial, but according to the authors, the larger barrier is the complex web of authorities that must sign off for an investor to build multi-state transmission lines. This problem could be overcome by allowing the Federal Energy Regulatory Commission to have authority over rights-of-way and use of eminent domain, as it does for natural gas transmission.
  • Storage: Large-scale battery storage can partially substitute for long-distance transmission connections by filling in when intermittent generation fades or demand surges. The cost of battery storage has dramatically decreased over the last decade and it likely has a significant role to play in balancing short-term fluctuations in supply and demand. Current battery technologies, however, are not cost competitive for long- duration storage and not likely to become so in the next decade.
  • Demand Flexibility: Electricity demand has become more volatile over time due to climate change, amplifying the challenge of meeting demand with intermittent generation sources. Dynamic demand adjustment is one tool for managing fluctuations in electricity consumption. For example, electric meters can measure consumption and communicate data directly and frequently to the utility. Such technologies can also be used with heating and cooling, refrigeration, and vehicles. Dynamic electricity rates can also provide incentives for customers to change consumption patterns as supply availability changes.
  • Dispatchable generation: The ability to store and transport energy to match supply to changes in demand is also a challenge. Current battery storage technology is not well suited for long-duration storage. Nuclear and hydroelectric energy generation can provide low-carbon, long-duration grid balancing in the near-term as wind and solar ramp up. Longer term, improvements in nascent technologies such as geothermal energy production or carbon capture and sequestration would be valuable for enabling greater amounts of dispatchable, low-cost clean power generation.

One specific area where policy can also promote and accelerate low-carbon technology is supporting the development of widespread electric vehicle (EV) charging infrastructure, including the electrical distribution system upgrades needed to support the service. Overcoming the network economics challenge of rapidly growing both EVs and EV charging infrastructure is important, but there is still great uncertainty about the best technologies, locations, and business models for EV charging. Hence, flexible approaches to government support are needed, with a goal of supporting experimentation on charger siting strategies and business models.

RESEARCH AND DEVELOPMENT INVESTMENT
Rapid innovation is needed on multiple fronts to address the challenges and opportunities outlined above. Given uncertainties about technological progress, the authors argue that broad incentives that do not discriminate across zero-emissions resources—such as carbon pricing, clean energy standards, or clean energy subsidies—will be essential for directing capital toward cost-effective investments in clean energy infrastructure.

In addition, direct government investment in research and development in the energy sector is necessary to promote uninhibited knowledge sharing across industries and countries, and particularly with the developing world. Most of the GHGs in the atmosphere today were put there by what are now wealthier nations. But wealthy countries also have a self- serving incentive to share low-carbon technologies in order to avoid having nations now coming out of poverty ramp up their growth through intensified use of fossil fuels, because emissions from that pathway will create spillover damages to the wealthier countries.

WHOLESALE MARKET DESIGN
A core challenge in electricity markets is how to reward suppliers whose value does not fit the standard per-kilowatt-hour compensation paradigm. These include sources that can change output rapidly on demand, such as battery storage and hydroelectric generation, as well as sources that can be stored for very long periods of time and then reliably operate when needed.

Wholesale electricity markets have also been hindered by policies that subsidize and/or mandate certain sources of electricity generation rather than taxing greenhouse gas emissions. Instead of increasing wholesale prices, as a carbon price would do, these approaches have reduced wholesale prices, which has squeezed the profits of nuclear, hydro, and other generation sources that are near carbon free but have not been included in states’ subsidies and mandates. This problem has been especially severe for existing nuclear power plants, many of which are not earning revenue sufficient to cover their ongoing operating costs. Because wholesale prices are depressed by renewable generation policies, the standard market test doesn’t convey appropriate information about whether these plants should continue to operate. In addition, the authors contend that transitioning from bilateral power trades to highly organized and centralized wholesale auctions could help reduce costs and promote dispatch of renewable generation.

SUSTAINABLE RETAIL PRICING AND DISTRIBUTED ENERGY RESOURCES
Many states that have aggressively pursued decarbonized energy have covered costs by increasing volumetric electricity rates, oftentimes above social marginal cost. These high prices discourage electrification, create perverse incentives for behind-the-meter (BTM) generation and storage (such as rooftop solar installation), and disproportionately burden low-income customers, making it one of the least-desirable funding options. Alternative funding sources, such as fixed monthly charges indexed to income, or allocating state and federal funds from other sectors would be less regressive than raising electricity prices.

ENERGY INFRASTRUCTURE AND LOCAL COMMUNITY IMPACTS
Energy infrastructure, while integral to US economic growth, has historically produced negative local environmental impacts and local pollutants that have disproportionately harmed disadvantaged communities. There are many policy choices that could have inequitable impacts in the transition to zero-emissions sources. For example, broad, zero- carbon incentive policies could fail to reduce emissions from sources of local pollution that are concentrated in “hotspots” near disadvantaged communities. Similarly, if carbon capture technologies become a significant mechanism for achieving zero emissions, then plants that continue to burn fossil fuels might still emit local pollutants, even if the carbon is captured. Thus, policies that incentivize zero-emission energy infrastructure must also be accompanied by policies that guard against the possibility of local pollution “hotspots” during the transition.

STRANDED FOSSIL FUEL ASSETS
The environmental hazards presented by the current stock of orphaned wells must be addressed by direct public investment in their decommissioning. The decommissioning of all of these wells – including restoration of their surroundings – is likely to cost more than $10 billion by one estimate. A silver lining to this necessary expenditure is that it provides an opportunity to employ oil and gas workers who would otherwise be displaced by the transition to zero-emission energy infrastructure. One estimate suggests that decommissioning the full inventory of orphaned wells would require 100,000 person-years of labor. The natural source of such labor would be displaced oil and gas workers, whose skills would naturally transfer to well decommissioning work. Well decommissioning would employ a valuable stock of human expertise that would otherwise depreciate away were these workers to move to another sector or drop out of the labor force. These job opportunities may also soften political opposition to the zero-emission energy transition. Although well decommissioning is not a long-run solution to displacement of oil and gas workers, it could serve as a temporary bridge to future employment opportunities in geothermal energy, offshore wind, carbon sequestration, or other clean energy technologies.

CONCLUDING OBSERVATIONS
The authors conclude their report by noting that the defining energy challenge of the 21st century is to transition the provision of energy services to zero-emissions sources, while simultaneously controlling costs and ensuring the reliability of energy supply. This transition will require historic investments in zero-emissions energy generation, transmission, storage, and distribution infrastructure. Federal policy choices will play a leading role in determining whether, where, and when these investments will occur, how costly they will be, and who will bear those costs.

Suggested Citation: Borenstein, Severin, and Ryan Kellogg. December 10, 2021. “Challenges of a Clean Energy Transition and Implications for Energy Infrastructure Policy”. In Rebuilding the Post-Pandemic Economy, edited by Melissa S. Kearney and Amy Ganz. Washington, DC: Aspen Institute, 2021. https://doi.org/10.5281/zenodo.14057590. 

Chapter

Executive Summary
Science and Innovation: The Under-Fueled Engine of Prosperity

Benjamin Jones (Kellogg School of Management at Northwestern University) argues that the United States is vastly underinvesting in science and innovation, hindering productivity growth. He presents evidence that increased public spending on research and development would lead to improvements in standards of living and health, enhance our economic competitiveness, and advance our nation’s capacity to respond to crises.

Jones reviews the empirical evidence of the benefits of basic science investments and, drawing on the evidence, calls for three spheres of policy action:

  1. Scaling funding resources: Evidence suggests that doubling the total U.S. public investment in R&D would easily pay for itself through social benefits in excess of costs. Jones notes that a sustained doubling of all forms of R&D expenditure could raise U.S. productivity and real per- capita income growth rates by an additional 0.5 percentage points per year over a long time horizon.
  2. Scaling the people pipeline into science and innovation careers: Jones emphasizes that achieving the benefits of the science and innovation system will rely on having a robust science and innovation workforce—a process which requires long-term investment to cultivate individuals with relevant training and talent. In particular, he highlights the potential large returns from increasing domestic investment in STEM workers and importing talent through reforms to high-skill immigration policies.
  3. Making diverse investments: Risk is inherent to the innovative process. Instead of trying to pick “winners,” policymakers and the public must approach high-risk investments as making a wide portfolio of bets. This approach can produce more efficient search, lower collective risk, and increase returns in the science and innovation system. Public funding should push for diverse pathways instead of crowding into particular areas, and focus on increasing the scale of funding and human capital, and the diversity of approaches that are taken.

Finally, Jones cautions that policymakers should not become hamstrung over which policy levers to employ, such as R&D tax credits, funding the NIH, investments through DARPA. There is a need for more research about which channels feature the highest returns, but, Jones argues, the biggest failure would be to continue to underinvest, given the enormous social returns that could be gained.

SCIENCE AND INNOVATION AS A PUBLIC GOOD
Left to its own devices, the private market will underinvest in R&D. When one party engages in costly and risky work to discover a new idea, any discovery can be imitated and built upon by others, creating broader social value to the original work. The original innovator is unlikely to capture this broader social value, and the private value to the original innovator can fall far short of the social value it creates. As a result, private incentives to invest in creating a new idea may be well below the social interest in making that investment. This is the basic market failure and incentive problem that surrounds the advance of ideas.

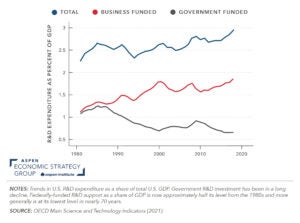
Public policy plays an important role in addressing this market failure by providing additional funding or incentives for R&D through a variety of mechanisms: government-sponsored research funding, intellectual property systems, research and development (R&D) tax credits, prizes, public research contracts, and advanced purchase commitments. Public funding for R&D investment as a share of US GDP is now at a 60-year low, as shown in Figure 1. This lack of investment is striking in light of recent and evolving challenges. The United States has faced a slowdown in productivity growth and rising concern about the international competitiveness of the U.S. workforce over many years, real wages for the median household have struggled to rise and have failed to keep pace with the gains in prior generations. Yet, as productivity has lagged, U.S. R&D intensity has slipped compared to other countries. In the mid-1990s, the United States was in the top five of countries globally in both total R&D expenditure as a share of GDP and public R&D expenditure as a share of GDP. Today, the United States ranks 10th and 14th in these metrics.

FIGURE 1: U.S. R&D SPENDING OVER TIME

THE EVIDENCE ON SCIENCE AND INNOVATION
Jones summarizes a large number of studies that estimate the social return to investment. He documents evidence on the very high social rates of return—in excess of 20% —found across agriculture, manufacturing, biomedical research, and in studies of the economy as a whole. In his own research conducted with Lawrence H. Summers of Harvard University, he finds the social rate of return to R&D expenditure in the U.S. economy appears to exceed 50%. Their analysis indicates that $1 invested in innovation produces, conservatively, at least $5 in social benefits on average—and quite possibly $10 or even $20 in social benefits per $1 spent.

COUNTERING THE SKEPTICS
Despite very high expected returns, the economic uncertainty and political risk inherent to federal investment in basic research have fueled skepticism about allocating scarce public funding to R&D. Innovative endeavors have a high failure rate. Since R&D is explicitly a search into unknown territory, judging success and failure ahead of time is difficult. And even when an idea is in hand, there is uncertainty about its future prospects, with eventual success often preceded by apparent failure. For every CRISPR breakthrough, there is also a Solyndra anecdote. Despite the risks involved, the evidence is abundantly clear: society reaps extremely large, long-run returns from public R&D investment.

Skeptics also question whether government officials have the capacity to identify and invest in good opportunities, or they question the value of experts themselves, who are often depicted as disengaged from “real-world” problems. Countering the skeptics of direct government funding, Jones documents the direct link between public funding and the public use of scientific research. Publicly-funded research has rich interfaces with public use, including for marketplace invention and government policy.

THE PEOPLE WHO DRIVE INNOVATION
A crucial driver of innovation are policies that advance human capital. Children exposed to innovators and entrepreneurs are more likely to become one themselves. In particular, girls who move to regions with higher shares of female inventors are more likely to become inventors. Importing talent through immigration is also critical. US immigrants patent more often than native-born Americans and make up a disproportionate share of the science and engineering workforce. Immigrants also account for a disproportionate share of entrepreneurs and are more likely to start companies of all sizes, including high-growth start-ups.

A VARIETY OF R&D POLICY LEVERS
There are myriad channels through which the federal government invests in R&D. For instance, DARPA invests in technology for national security, the tax code features R&D tax credits for private sector innovators, the NIH, Department of Energy, and the National Science Foundation fund research through a large network of national laboratories, research universities, and private-sector research contracts.

Large social returns to R&D are observed across all channels. It is less clear from the research which channels yield the highest returns. Jones cautions against allowing this uncertainty to lead to inaction altogether. While it is possible that such information would produce even higher returns, the true failure is not to put more resources toward R&D investment overall, which would lead to enormous positive returns.

Suggested Citation: Jones, Benjamin F. December 10, 2021. “Science and Innovation: The Under-fueled Engine of Prosperity”. In Rebuilding the Post-Pandemic Economy, edited by Melissa S. Kearney and Amy Ganz. Washington, DC: Aspen Institute, 2021. https://doi.org/10.5281/zenodo.14057609.

Chapter

Executive Summary
Economic Perspectives on Infrastructure Investment

THE ECONOMICS OF FEDERAL INFRASTRUCTURE INVESTMENT
Bipartisan support for new infrastructure spending reflects a consensus view that well- chosen infrastructure investments would enhance American economic competitiveness and increase the economy’s productive capacity. Sound investments also have the potential to accelerate the US economy’s transition to sustainable energy sources and to address some of the sources of income inequality, such as access to transportation services.

In Economic Perspectives on Infrastructure Investment, James Poterba of MIT and Edward Glaeser of Harvard highlight policy relevant lessons from the voluminous research literature on the economics of infrastructure projects. They draw four main conclusions that inform the design of an infrastructure-spending program:

  1. Project-based consideration of costs and benefits is an essential input in determining the optimal level of infrastructure investment.
  2. Cost control should be an integral part of infrastructure project planning, starting with procurement procedures and planning for the possibility of project delays and unexpected costs.
  3. User fees can, in some settings, be an attractive source of revenue to cover capital costs and ongoing maintenance needs. When set to reflect the marginal cost of using infrastructure, these fees encourage efficient utilization.
  4. Though public-private partnerships and the privatization of infrastructure assets can sometimes enhance operational efficiency and improve both procurement and management, private provision can shift risks to the public sector.

Glaeser and Poterba describe in detail the research that leads to these policy-relevant conclusions. Their paper describes various approaches to assessing the appropriate level of infrastructure investment and to undertaking cost-benefit analyses. They also discuss why the costs associated with U.S. infrastructure projects appear high by international standards, and why there is such variability in costs across similar projects. They discuss the challenges of financing of infrastructure projects and describe some of the political economy challenges that they face.

OPTIMAL INFRASTRUCTURE INVESTMENT
The authors stipulate that the optimal level of infrastructure investment should be determined by a project-by-project consideration of the costs of acquiring infrastructure capital and the benefits of using it. This approach contrasts with an “engineering” approach —such as that of the American Society of Civil Engineers (ASCE) and some historical approaches to estimating infrastructure demand—which define infrastructure needs without reference to the costs of meeting them, and often without recognizing alternatives to infrastructure spending as a way of meeting these needs.

Cost estimates include inputs such as concrete and steel, construction labor, borrowing costs, potential disamenities such as pollution, and distortions associated with tax finance or other funding mechanisms. Benefit calculations should should include the project’s impact on the users of the infrastructure, as well as society as a whole through channels such as macroeconomic stimulus. With a fixed budget for infrastructure investment, projects should be undertaken in order of their benefit-to-cost ratio. Because borrowing costs are one of the costs of infrastructure projects, a fall in real interest rates translates into an increase in the optimal level of infrastructure investment would rise, all else equal.

The paper presents some evidence that calls into question the prevailing narrative of America’s “crumbling infrastructure.” Interstate highways today are smoother, fewer bridges are structurally deficient, and dam collapses are less frequent than in the past. The cost-benefit approach to infrastructure analysis recognizes that in some cases, when estimated benefits of a given project are low, it may be more cost-effective to a structurally compromised bridge or road than rebuild or repair it.

PROJECT SELECTION USING COST-BENEFIT ANALYSIS
The application of project-specific cost-benefit analysis to individual infrastructure projects, and a comparison of cost-benefit ratios across projects, is quite different from a policy process that establishes an aggregate spending number and then allocates that amount to different jurisdictions based on population or other considerations. Even with a top-down allocation, however, cost-benefit analysis can play an important role in project selection at the state or local level when a fixed pool of resources must be allocated across alternatives.

Glaeser and Poterba acknowledge that cost-benefit analysis involves considerable uncertainty, which means the evaluator has opportunities to exercise discretion. It is thus important to develop institutions that can perform non-partisan, rigorous cost-benefit calculations and use a systematic approach. They highlight six features of cost-benefit analysis that are similar across many forms of physical infrastructure: estimating future benefits, measuring systemic impact, assessing ancillary benefits and costs, estimating macroeconomic effects (such as anti-recessionary stimulus and agglomeration economies), measuring impact on GDP and productivity, and considering distributional impacts.

The authors acknowledge the practical difficulty of performing project specific cost-benefit analyses before legislation is passed. Doing so would involve a lengthy process that doesn’t often fit with the political reality of legislative debate and passage. Given this reality, they consider three ways in which cost-benefit analysis could be inserted more directly into the process of allocating U.S. infrastructure spending. One is to estimate the benefits of infrastructure spending as a whole, rather than the benefits of particular projects, and to compare this with the social costs of raising funds for infrastructure projects. There are important limitations of such an approach, notably the difficulty of establishing a credible

estimate of the social benefit of national spending. The second is the creation of an infrastructure bank that would receive some fraction of federal infrastructure spending and allocate the funds to projects that appear to have particularly high benefits relative to costs. The authors caution that while in principle, an infrastructure bank could be a nimble agency that chooses high return projects, it runs the risk of becoming a political tool. A third option, which the authors view as the most likely to succeed, would involve federal mandates for states to make more use of cost-benefit analysis when they spend federal dollars, perhaps with input from a federal agency that develops and applies cost-benefit methods.

AMERICA’S UNIQUELY EXPENSIVE INFRASTRUCTURE AND OPTIONS FOR COST- CONTAINMENT
American infrastructure costs are very high by international standards, which could imply that the optimal amount of infrastructure investment in the U.S. is lower than in other countries. Some recent projects, such as the East Side Access project in New York City which cost $4 billion per kilometer of tunnel, are the most expensive infrastructure expansions anywhere. Costs also appear to have risen over time. Highway costs, according to the DOT National Highway Construction Cost Index, increased by 32% in real terms between 2003 and 2020.Though it is difficult to draw general conclusions about cost drivers, expensive designs, procurement costs, and labor costs all seem to contribute.

The authors suggest several strategies to control costs. Maintaining existing infrastructure is often more cost-effective than building new projects, although the political system sometimes exhibits “ribbon-cutting bias” in favor of new projects. Other strategies include:

  • Applying cost-benefit analysis
  • Purchasing from low-cost suppliers, if necessary by relaxing “Buy American” provisions
  • Streamlining environmental reviews
  • Harmonizing implementation of prevailing wage requirements Strengthening local procurement offices.
  • Improving procurement practices and project management.

FINANCING INFRASTRUCTURE EFFICIENCY AND EQUITY CONSIDERATIONS
User fees and congestion charges are efficient ways to pay for infrastructure construction and maintenance, although distributional considerations often restrict their use. Requiring users to pay for their infrastructure limits overuse and generates revenues. Although in some cases low-income users of infrastructure would be disproportionately burdened by user fees, this is not the case for all types of infrastructure. Given different patterns of infrastructure use at different income levels, some user fees, such as airport user fees, would be charged primarily to higher income individuals. Furthermore, the impact of user fees on low-income users could be offset with targeted rebates or vouchers.

Another approach to funding infrastructure spending is the use of public private partnerships (PPPs). Such partnerships are a means of bringing in financial support beyond that available from the public sector. However, public-private partnerships and the privatization of infrastructure assets can also pose risks to the taxpayer. Glaeser and Poterba note that private providers sometimes negotiate advantageous terms in bargaining with state and local governments, and they point out in some cases, the cost of capital for the public entities may be lower than that for private investors.The private sector may bring important operational and procurement advantages to infrastructure projects.Those considerations, as well as capital access advantages in some cases, can justify public- private ventures or privately-provided infrastructure.

POLITICAL CHALLENGES AND PITFALLS
There are numerous political challenges that confront infrastructure policy in the U.S. These include limited interest in maintaining existing assets and special interests blocking valuable projects.States have the greatest opportunity to address many of these problems, given their ability to govern local politics, pass state laws relating to the environment, or change the procurement process for state agencies. Reducing costs may require the federal government to interact with the states and to make reform a precondition for funding. The authors suggest that a federal authority could negotiate with states on a project-by-project basis in order to lower costs and increase value.

Suggested Citation: Poterba, James, and Edward Glaeser. December 10, 2021. “Economic Perspectives on Infrastructure Investment”. In Rebuilding the Post-Pandemic Economy, edited by Melissa S. Kearney and Amy Ganz. Washington, DC: Aspen Institute, 2021. https://doi.org/10.5281/zenodo.14057633.

Chapter

Executive Summary
14 Facts about US Investments in Infrastructure and R&D

DOWNLOAD

Bipartisan support in Congress is emerging for new strategic investments in science and technology, in addition to a trillion-dollar infrastructure deal. These proposals reflect an emerging consensus that large-scale government investments are necessary to support the US economy’s transition to sustainable energy sources, address underlying sources of domestic inequality, and promote American economic competitiveness. 

In order to inform the debate over the size and scope of new investments, we present this set of 14 facts with the goal of advancing an accurate understanding of the current state of public investment in the United States and, in particular, investment in infrastructure and research and development (R&D). As demonstrated in this memo, however, this is impossible to characterize the current situation in simple soundbites. On the one hand, US public investment in R&D is at a 60-year low. On the other hand, private R&D investment in the United States is reaching historic highs. America’s highway infrastructure is aging and the cost of building new roads has risen dramatically, but road quality also continues to improve and highways are becoming smoother. The United States invests less in transportation infrastructure as a share of GDP, on average, than the OECD or China. But the United States still leads the world in total (combined public and private sector) R&D investment.    

The charts below provide a nuanced picture of federal investment and specifically nondefense investment, which falls into three categories: education and training, physical capital, and R&D. We focus on the latter two categories, in particular.1 Section I describe long-run trends in R&D and physical capital investments in the United States. Section II describes trends in overall infrastructure investment, by sector and across different categories of investment, highlighting the rise of digital infrastructure investment. Section III looks at unique features of the US highway infrastructure. Finally, Section IV places trends in US public investment into context by comparing them with investment trends in China and other advanced economies.

I. Overall Trends in Government Investment

Government investment has the potential to boost long-run productivity, wages, standards of living, and international competitiveness and to help redress long-standing sources of inequality.  Government investment also provides public goods and services that the private sector tends to underproduce. For example, public funding for research and development has large, positive social externalities that private firms do not take into account when making decisions about how much to invest. Unlike public consumption, which often focuses on smoothing business cycles, government investment is made with an eye toward long-term economic goals.

In 2018, the US government invested less as a share of the economy relative to any other year since the early 1960s. This fact is especially striking since government debt as a share of the economy reached 104% in 2018, nearly surpassing the previous peak during World War II. With the exception of a temporary increase in funding for infrastructure projects and investment in response to the Great Recession, the recent run-up in federal debt has largely financed public consumption rather than investment.

1. Total federal investment as a share of the economy is declining.

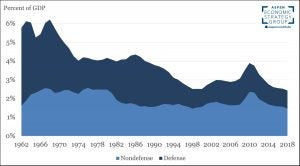
Figure 1: US federal investment as a share of GDP, 1962–2018

Source: CBO.

Figure 1 shows the breakdown of federal investment as a share of GDP across defense and nondefense categories. At 2.4% of GDP, total investment is far below the 1968 peak of 6.2%. Although both types of investment have declined, defense investment as a share of the total is shrinking at a faster rate. In 1962, defense investment made up 72% of the total. By 2018, that share had fallen to under 40%.

2. US federal investment in R&D and physical capital is at historic lows, while federal investment in education and training remains on par with the historical average.

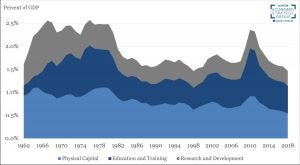
Figure 2: US federal nondefense investment as a share of GDP, 1962–2018: physical capital, education and training, and R&D

Source: CBO and author’s calculations.

Figure 2 breaks down nondefense investment into its three primary categories: physical capital, education and training, and R&D. As a share of the economy, the US federal government invested just under 1.5% of GDP across all three categories in 2018. This is well below the historical average of 2% of GDP per year and is the second lowest level between 1962 and 2018. 

US investments in physical capital peaked in the 1960s and 1970s at 1.1% of GDP, a period which included the construction of the interstate highway system. Physical capital investment increased temporarily to 0.9% in 2009 and 2010 due to investments associated with the passage of the American Recovery and Reinvestment Act (ARRA). 

Federal investment in education and training rose from less than 0.5% in the 1960s to nearly 1% of GDP by 1975 due to a large increase in spending on elementary, secondary, and higher education and on education benefits for Vietnam War veterans (CBO 2019). By 1985, it had shrunk back down to just under 0.5%. Education investment as a share of the economy rebounded to 1% of GDP again in 2010 under ARRA, which temporarily increased funding for Pell grants for higher education, along with spending for K-12 education and secondary and vocational training. Today, at 0.6% of GDP, education and training investment is on par with the average over the previous six decades. 

Federal nondefense investment in R&D has steadily declined for several decades. It has consistently been below 0.5% of GDP since the early 1980s, and now, at just 0.3% of GDP, has reached the lowest share on record.

Recently, there has been heightened political interest in increasing federal R&D spending to increase American competitiveness with China. The Innovation and Competition Act (2021), passed by the US Senate in June 2021 with bipartisan support, authorizes over $140 billion over five years to fund R&D activities through the National Science Foundation, the Department of Commerce, the Department of Energy, and NASA. If implemented, the Act would increase federal R&D spending to more than $90 billion per year over the next five years—almost double the historical average of $46.4 billion per year (in 2018 dollars).

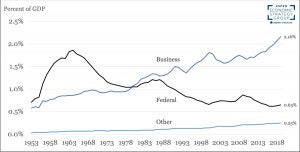
3. Although federal R&D investment is near a historic low, business R&D has been rising for decades.

Figure 3: US R&D spending by source, 1953–2019

Source: National Center for Science and Engineering Statistics (NCSES) National Science Foundation, Table 1.

Alongside declines in federal R&D investment, R&D investment by the business sector has been on an upward trend for over half a century. In 1980, US private sector R&D investment surpassed that of the federal government (Figure 3) and the gap continues to widen. From 2010 to 2019, total inflation-adjusted R&D investment grew at a pace of 3.3% per year, which was driven entirely by private investment and outpaced the average real GDP growth of 2% over the same period (NCSES 2021). One might suspect from looking at these trends that public and private investment are substitutes, but existing research suggests the opposite is the case. For example, OECD (2000) finds an additional dollar of government R&D investment increases business-financed R&D by 1.7 dollars, on average.  

Business R&D reached a high of 2.2% of GDP, or roughly $463 billion in 2019. Meanwhile, total federal R&D spending was just over 0.6% of GDP in 2018, among the lowest levels on record. “Other” R&D spending remains a small but growing portion of total R&D spending and includes investment by state and local governments, higher-education, and non-profit institutions.

Although direct federal spending on R&D is declining as a share of the economy, the federal government also promotes private sector R&D through the federal R&D tax credit. In 2021, the Joint Tax Committee (2018) estimates federal expenditures through the R&D tax credit to be worth $11.6 billion. These tax credit benefits are not included in the direct federal spending amounts depicted in Figure 3. However, the share of R&D tax incentives in total government support for R&D has increased over time, from approximately 29% in 2000 to 38% in 2016 (OECD 2020).

II. US Infrastructure Assets and Investments

This section explores trends in US infrastructure investment and the stock of infrastructure assets. As recent public debates illustrate, defining what constitutes infrastructure is a difficult undertaking. We rely on definitions provided by Bennett et al. (2019), who analyze the national economic accounts to define and measure three broad categories of infrastructure investment: basic, social, and digital. The authors define “basic” infrastructure as traditional assets such as transportation, water, sewer, and power. “Social infrastructure” refers to public and private hospitals, schools, and public safety facilities. Finally, “digital infrastructure” includes communications structures and equipment, software, and computers.

Public capital (infrastructure) and technological progress (driven by R&D) can play an important role in stimulating both long-run economic growth and labor productivity (and thereby long-run wage growth). Increasing the amount of capital available per worker hour, known as capital deepening, and technological progress are important drivers of labor productivity, along with human capital investments. Public investments that raise the total amount of capital available per worker and accelerate technological innovation through investments in R&D fuel productivity growth and therefore long-run wage and economic growth. Ramey (2020) summarizes existing estimates of the elasticity of output to public capital, which range from .08 to .39.

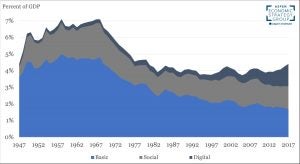
4. Basic infrastructure still accounts for the largest share of infrastructure spending across public and private sectors, but the share of digital infrastructure investment is catching up.

Figure 4: Infrastructure investment by type, 1947–2017

Source: Bennett et al. (2019), BEA, author’s calculations.

Total infrastructure investment across all categories (basic, social, and digital) and across public and private sectors has remained relatively steady since the early 1980s, but the composition of spending has changed significantly. In 2017, digital infrastructure investment was 1.4% of GDP compared to 1.4% for social infrastructure and 1.7% for basic. This is in contrast with the year 1980, when digital infrastructure was just 0.33% of GDP, social was 1.2%, and basic was more than 3.1%. Since the year 2000, constant dollar digital infrastructure investment has increased by an average of 6.7% per year, while social infrastructure has increased by 1.9% per year, and basic infrastructure has grown at an average pace of just 0.5% per year.

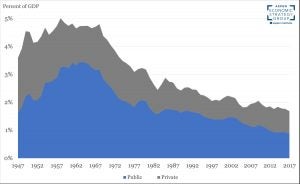
5. Total spending on basic infrastructure across the public and private sectors is at a historic low.

Figure 5. Basic infrastructure investment by sector, 1947–2017

Source: Bennett et al. (2019), US Census Bureau, author’s calculations.

Figure 5 focuses only on basic infrastructure, including water, sewer, power, and conservation and development across public and private sectors. Total investment in this category peaked in the late 1950s, driven by public investments in the federal highway system. Both total basic investment and public sector basic investment as a share of GDP reached a minimum in 2017 at 1.68% and 0.87%, respectively. When measured on a per-capita basis, public and private basic infrastructure investment have converged over time. In 2017, per-capita private infrastructure spending was $455 per person per year, compared to a historical average of $340 per person. The same year, public spending was $486 per person per year, compared to a historical average of $566 per person.

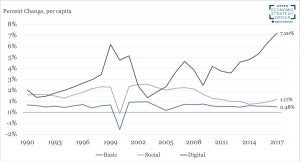
6. The growth rate of digital infrastructure assets per capita reached an all-time high in 2017, while growth in the stock of other infrastructure assets is slightly above population growth.

Figure 6. Growth rate of the real net stock of basic, social, and digital infrastructure assets, per capita, 1990–2017

Source: Bennett et al. (2019), US Census Bureau, author’s calculations.

Figure 6 shows the growth rates of the stock of infrastructure per capita, in contrast to the flow measures of infrastructure investment  shown in Figures 4 and 5.  Measuring the stock of infrastructure assets helps to inform how well infrastructure investment is keeping up with the depreciation of assets and is thus an indicator of infrastructure’s productive capacity. We focus on per capita measures of infrastructure assets rather than stocks as a share of the economy because the amount of capital per worker (including public capital) drives labor productivity. 

Figure 6 illustrates that basic infrastructure investment has just kept pace with population growth, growing at an average rate of 0.5% per year since the late 1990s. The stock of social infrastructure assets per capita has grown at an average pace of 1.6% per year since 1990, peaking in the early 2000s at 2.5% before the financial crisis of 2008. For the period 2010–2017, social infrastructure investment has grown at just 1% per year, on average. The story of digital infrastructure investment stands in sharp contrast to the other categories. The growth of the stock of digital infrastructure per capita has accelerated since 1990, growing at an average pace of 3.5% over the period 1990–2017 and peaking in 2017, the latest year for which data was available, at 7.2%.

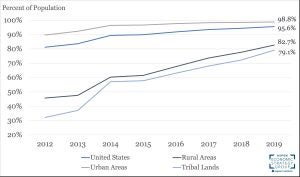
7. The United States has made significant progress in expanding broadband internet access over the past decade.

Figure 7: Deployment of fixed terrestrial 25/3 Mbps services, by area type, 2012–2019

Source: FCC.

The availability of broadband internet is an issue of longstanding interest among policymakers. Moreover, the COVID-19 pandemic further underscored its increasing importance for economic opportunity and education. Figure 7 shows that broadband internet coverage has seen consistent and significant gains in recent years. The Federal Communications Commission (FCC) defines broadband internet by a benchmark download speed of 25 Mbps and an upload speed of 3 Mbps for fixed services. By 2019, 95.6% of Americans had access to fixed terrestrial broadband service, up from 81.2% in 2012. The largest gains over the period took place in rural and tribal areas, although they continue to lag behind urban residents. In 2019, an estimated 14.5 million Americans (4.4%) lacked access to fixed terrestrial broadband, with 11.3 million (17.3%) in rural areas, 846 thousand (20.9%) in tribal lands, and 3.2 million (1.2%) in urban areas (FCC 2016 – 2021).

III. Transportation Infrastructure

The idea that America’s transportation infrastructure is aging and therefore decaying is a common motivation for new physical infrastructure investments. This section highlights relevant facts about the US highway infrastructure that challenge this notion. We also highlight the large differences in the amount of spending on highways across states and the fact that the cost of building new highways has risen over time. For the sake of length, we focus on highways, but refer readers to the work of Duranton, Nagpal, and Turner (2020) for a discussion of the quality and condition of other types of transportation infrastructure, including bridges, bus transit, and subways.

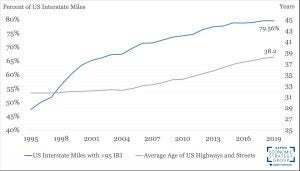
8. The US interstate system is aging, but road conditions are improving.

Figure 8: Average age of US highways and streets vs. share of US interstate miles with the lowest International Roughness Index ratings, 1995–2019

Source: Federal Highway Administration, BEA, author’s calculations. Note: IRI data not available for 2010.

The majority of the US interstate highway system was built between the 1960s and early 1990s. As a result, the average mile of road on an interstate highway is nearly 40 years old. However, this aging does not necessarily reflect a crumbling infrastructure system; highway quality today is as good as ever. Figure 9 illustrates the relationship between the average age of US highways and the percent of US interstates that rate the best in the International Roughness Index (IRI). The IRI was devised by the World Bank in 1986 to create a standardized roughness measurement of roads and highways (TRID 1995).2 IRI ratings can range from less than 60 inches per mile to more than 220 inches per mile, though any rating less than 95 inches per mile is generally considered “good” (MDOT). As shown in Figure 9, despite the aging of the US interstate system, the percentage of US interstate miles with a “good” IRI rating has increased more than 30 percentage points since 1995. Continued federal funding for maintenance and operations (shown in Figure 11) has resulted in smoother highways over time.

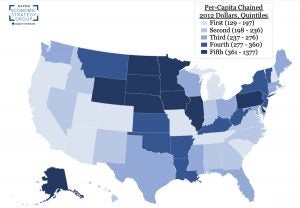
9. There are large differences in the level of highway spending per capita across states.

Figure 9: Per capita public highway infrastructure investment by state, 2017

Source: Bennett et al (2019), author’s calculations.

Figure 9 illustrates the variation in per-capita spending by state on highway infrastructure. The range of funding extends from $129 per person in Michigan to ten times that amount ($1,377) in North Dakota. Several of the least populous states in the Midwest and North Central states (Iowa, Minnesota, Nebraska, North Dakota, South Dakota, and Wyoming) are in the  highest quintile of states in terms of highway spending per capita. In contrast, states in the western United States, including Arizona, California, Colorado, Oregon, and Utah, are in the bottom quintile of highway spending per capita. Many economists have documented that expected returns to additional highway infrastructure vary significantly across states, with greater returns in more dense areas (Allen and Arkolakis 2019; Poterba and Glaeser 2021). For example, Allen and Arkolakis (2019) find large welfare benefits from additional highway construction in California and in the greater New York City area. However, per-capita spending appears to be more closely related to geographic location rather than to states’ population density.

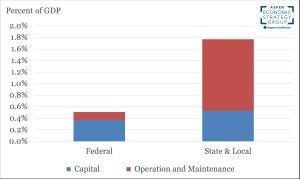
10. States spend most of their infrastructure funds on operations and maintenance.

Figure 10: Spending on transportation and water infrastructure, by category of spending, 2017

Source: CBO.

Figure 10 shows the breakdown of US transportation and water infrastructure spending across the federal vs. state and local government, after federal grants and transfers to states. The figure also illustrates the different uses of infrastructure funding at different levels of government. The vast majority of state and local funding goes to operations and maintenance rather than new physical infrastructure. Given the maturity of US transportation and water infrastructure, maintenance and operations can be expected to account for a large share of total spending.  In fact, total state and local infrastructure spending has increased over time, driven by operations and maintenance. In contrast, the majority of federal funding for transportation and water infrastructure goes to capital investments rather than operations and maintenance.

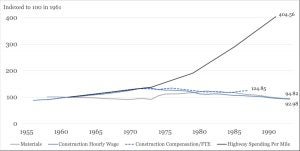
11. The cost of US highway infrastructure has dramatically increased since the mid-1970s.

Figure 11: Spending per mile of new highway construction, 1955–1993

Source: Reproduced from Brooks and Liscow (2020).

An important consideration for policymakers when determining the desired amount of infrastructure is cost. As Poterba and Glaeser (2021) highlight, building infrastructure in the United States is far more expensive than in the rest of the world. Figure 11 focuses specifically on highway construction, illustrating the dramatic increase in cost per new highway mile that occurred between the mid-1970s and the 1990s, when the US interstate system was constructed. Over the period from 1973 to 1991, highway spending per mile increased 193%. Brooks and Liscow (2020) document that increased spending does not correlate with increases in construction wages or the cost of materials, such as concrete, construction machinery, construction sand, paving mixtures, and steel mill products. Over the period, materials prices rose by only 7% and construction hourly wages decreased in real terms by 39%. The authors find increased highway construction costs are positively correlated with increases in incomes and housing values over the same period, as well as an increase in local demands for physical structures to be built along with Interstates that alleviate concerns about noise or other negative externalities.

IV. International Comparisons

A primary motivation among policymakers for dramatically increasing US infrastructure investment is a desire to remain economically competitive with the rest of the world. This section highlights how the United States compares to other countries by some of the metrics discussed above. While it is true that the United States trails other advanced economies in transportation spending, the opposite is true for R&D investment when private sector investments are taken into account. We also highlight the dramatic increase in public investments by China in recent decades.

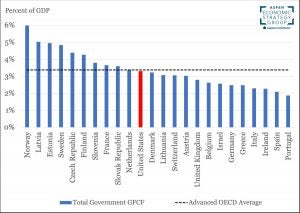
12. US gross capital formation is in the middle of the pack among advanced OECD economies.

Figure 12a: Government gross fixed capital formation as a share of GDP in advanced OECD countries, 2019

Source: OECD Statistics Datasets 1 & 11 and authors’ calculations. Note: Data for Japan not available for the year 2019.

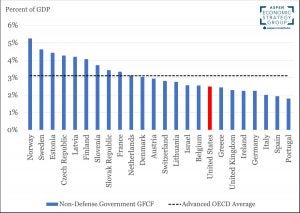
Figure 12b: Government nondefense gross fixed capital formation in advanced OECD countries, 2019

Source: OECD Statistics Datasets 1 & 11 and authors’ calculations.

Figures 12a and 12b compare levels of US fixed capital formation—or investment in productive assets—relative to other advanced OECD countries. In 2019, the United States ranked 11th of 24 in total capital formation among advanced OECD economies when defense investments are included. As Figure 12b shows, the United States falls to 17th among advanced OECD economies when comparing only nondefense investments. The United States ranking among this group has not improved in recent decades: in 2000, the United States ranked 11th in total fixed capital formation and 14th in nondefense fixed capital formation.

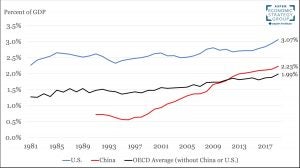
13. The United States exceeds China and the OECD average in total R&D investment as a share of GDP.

Figure 13: Total R&D investment (public and private) as a share of GDP in selected countries, 1981–2019

Source: Figure 3 in Van Reenen (2019), OECD, author’s calculations. Note: The OECD defines gross domestic spending on R&D as “the total expenditure (current and capital) on R&D carried out by all resident companies, research institutes, university and government laboratories, etc., in a country.” It includes R&D funded from abroad, but excludes domestic funds for R&D performed outside the domestic economy.

Figure 13 illustrates overall R&D investment in the United States, China, and the OECD average, excluding China and the United States. Although federal funding for R&D in the United States has been declining, the private sector’s contribution places the United States above the OECD average as a share of GDP. Despite being above average, the United States invests less in R&D than some advanced economies as a percentage of GDP. South Korea leads the OECD overall, investing nearly 5% of its economy into R&D in 2019. Germany and Japan also exceed the United States in R&D investment as a share of their economies. 

China has experienced rapid growth in R&D investment since the mid-1990s, outpacing its overall economic growth and rising to 2.2% of its economy by 2019. The country’s total R&D investment when measured in constant dollars increased by an average of 14% per year between 1991 and 2019. 

Among the four largest western economies—the United States, Germany, the United Kingdom, and France—only Germany has made a meaningful increase in R&D investment as a share of its economy since 2000, increasing investment by 2.7% per year.

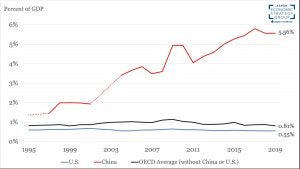
14. Transportation infrastructure spending as a share of GDP is far higher in China than in the United States or the OECD average.

Figure 14: Transportation infrastructure across select economies, 1995–2019

Source: OECD.

Figure 14 shows investment in transportation infrastructure, including both new structures and maintenance, as a share of GDP across advanced economies. Although the initial stock of infrastructure varies by country, China far outpaces other advanced economies in both the share and level of transportation investment. The United States also trails most other advanced OECD countries in transportation infrastructure investment. At just 0.6% of GDP, the United States lags behind France, Germany, Japan, Korea, and the United Kingdom in transportation infrastructure investment as a share of their economies.


The data underlying these figures are available for download here.


1 See Expanding Economic Opportunities for More Americans

2 According to the FHWA, a road’s IRI rating is “calculated from a single longitudinal profile measured with a road profiler in both the inside and outside wheelpaths of the pavement. The average of these two IRI statistics is reported as the roughness of the pavement section.” (FWHA).

13 Aspen Economic Strategy Group Reports related to the American Jobs and Families Plans

The Biden Administration’s American Jobs Plan and American Families Plan propose over $4.1 trillion in new government spending over the next 10 years, aiming to fundamentally reshape and expand the social safety net, increase the economy’s productive potential through investments in physical and human capital, and make major public investments in green infrastructure and technology. 

The Aspen Economic Strategy Group (AESG) has produced a number of reports in recent years that speak directly to the policy challenges addressed in these plans. We highlight 13 directly relevant AESG reports below. Some of the proposals contained in the administration’s plans are consistent with the evidence and suggestions of AESG authors; some are not.


Climate


“The President is calling on Congress to invest $35 billion in the full range of solutions needed to achieve technology breakthroughs that address the climate crisis and position America as the global leader in clean energy technology and clean energy jobs.”

“[President Biden’s plan] targets investments to support infrastructure in those communities most vulnerable physically and financially to climate-driven disasters and to build back above existing codes and standards.”

-American Jobs Plan Fact Sheet, 2021


The Biden plan recognizes the need for climate change reduction, mitigation, and adaptation policies. More than 100 countries have already pledged to achieve net-zero emissions within the next 30 years. While emissions reduction is a necessary step, AESG authors have argued that it is only one component of the four-pronged approach that’s needed to address climate change.

  1. In their 2020 report, David Keith and John Deutch highlight the potential and necessity of technological breakthroughs to reduce carbon emissions and mitigate the effects of climate change. They observe that four “climate control mechanisms” have the capacity to create a politically stable and economically sound climate policy: (1) emissions reduction; (2) carbon dioxide removal; (3) adaptation; and (4) solar radiation modification. Embracing all four approaches will require a robust, multiyear R&D program and adoption of a stable greenhouse gas emission charge. The authors also recommend changes to climate governance in the United States, including the creation of a single, joint congressional committee to oversee all climate policy. 

Biden’s American Jobs Plan acknowledges that climate challenges disproportionately affect disadvantaged communities in the U.S. and around the world, noting that “… people of color and low-income people are more likely to live in areas most vulnerable to flooding and other climate change-related weather events.”

  1. Trevor Houser’s 2020 AESG report documents the unequal distribution of climate-related damages, drawing on recent econometric research and climate models to project geographical changes in climate patterns. He underscores the varying impact of warming on social and economic outcomes and highlights the need for adaptation policies, such as preparing for climate displacement and promoting infrastructure resilience.

The Biden plans offer several strategies to pay for increased spending. However, a carbon tax, which could raise substantial revenues while also correcting market failures, is notably absent.

  1. In his 2020 report, Gilbert Metcalf argues that a pledge to net-zero emissions is infeasible without putting a price on carbon. He also addresses common political concerns about adopting such a tax, including potential impacts on American international competitiveness, distributional consequences, and the potential for job displacement.  He demonstrates that a border tax adjustment would ameliorate concerns about the tax’s impact on competitiveness, while revenues can be redistributed in such a way to address distributional concerns. He also shows that such a tax can be designed to change the composition of jobs in the economy without reducing the total quantity of jobs.


Human Capital Investments


“President Biden is calling for … $109 billion for two years of free community college so that every student has the ability to obtain a degree or certificate. In addition, he is calling for an over $80 billion investment in Pell Grants, which would help students seeking a certificate or a two- or four-year degree. Recognizing that access to postsecondary education is not enough, the American Families Plan includes $62 billion to invest in evidence-based strategies to strengthen completion and retention rates at community colleges and institutions that serve students from our most disadvantaged communities.”

-American Families Plan Fact Sheet, 2021

“President Biden is calling on Congress to invest $12 billion to … invest in community college facilities and technology… [The President is also] calling on Congress to invest a combined $48 billion in American workforce development infrastructure and worker protection. This includes registered apprenticeships and pre-apprenticeships, creating one to two million new registered apprenticeships slots.”

-American Jobs Plan Fact Sheet, 2021


The Families Plan calls for enhanced funding to higher education institutions to invest in evidence-based strategies to strengthen completion and retention rates at community colleges and institutions that serve students from our most disadvantaged communities.

  1. A 2019 AESG report by Amy Ganz, Austan Goolsbee, Glenn Hubbard, and Melissa Kearney highlights the critical role of community colleges in the U.S. higher education landscape. Community colleges serve millions of students each year, disproportionately minority and low-income students. However, completion rates at community colleges are low. Their proposal calls for increased funding (on the order of $20 billion) to community colleges contingent on improved institutional outcomes. The report highlights evidence showing that enhanced student support improves retention and completion outcomes.
  1. A 2019 report by AESG author Robert Lerman emphasizes the promise of work-based learning programs as a means to skill development. Lerman argues that a large-scale apprenticeship program could address stagnant wages and waning career prospects for non-college educated workers, while also providing additional gains for employers and for the U.S. economy.


Investments in Innovation and R&D


“U.S. leadership in new technologies–from artificial intelligence to biotechnology to computing–is critical to both our future economic competitiveness and our national security. President Biden is calling on Congress to invest $50 billion in the National Science Foundation (NSF), … provide $30 billion in additional funding for R&D that spurs innovation and job creation, … [and] invest $40 billion in upgrading research infrastructure in laboratories across the country.”

-American Jobs Plan Fact Sheet, 2021


U.S. federal funding of R&D has substantially declined since the early 1960s. The Jobs Plan calls for increased federal funding of R&D and innovation research. 

  1. In a 2019 AESG report, John Van Reenen highlights the significance of the decline in federally funded R&D, showing that it has coincided with lackluster productivity and wage growth for several decades. To combat these challenges and spur technological progress, Van Reenen recommends three groups of innovation policies: tax credits, direct subsidies, and human capital investments.
  1. AESG author Chad Syverson makes the case for broad government investment policies, rather than subsidizing specific industries, to spur innovation and productivity growth. Syverson argues that a multifaceted approach to addressing negative productivity patterns is most sensible. He recommends adopting policies aimed at targeting infrastructure investment, improving managerial practices, increasing product market competition, and reducing input frictions in markets.


Place-Based Policy


“For decades, exclusionary zoning laws–like minimum lot sizes, mandatory parking requirements, and prohibitions on multifamily housing–have inflated housing and construction costs and locked families out of areas with more opportunities. President Biden is calling on Congress to enact an innovative, new competitive grant program that awards flexible and attractive funding to jurisdictions that take concrete steps to eliminate such needless barriers to producing affordable housing.”

“President Biden is calling on Congress to invest $31 billion in programs that give small businesses access to credit, venture capital, and R&D dollars.”

“President Biden’s plan will turn idle rural and urban property into new hubs of economic growth and job creation [and] bring these communities new critical physical, social, and civic infrastructure. The President’s plan prioritizes building “future proof” broadband infrastructure in unserved and underserved areas so that we finally reach 100 percent high-speed broadband coverage.”

-American Jobs Plan Fact Sheet, 2021


There is ample evidence of persistent divergence in economic outcomes across U.S. localities. The Jobs Plan recognizes the need for investments in economically depressed localities. It also recognizes that barriers to geographic mobility, including land use restrictions that drive up housing prices in high-productivity areas, impede the ability of people to move to places where they would encounter better economic opportunities. Such barriers ultimately decrease overall employment, productivity, and earnings. 

  1. In a 2019 AESG report, Joshua Gottlieb estimates U.S. GDP and wages are $2 trillion and $1.3 trillion below their potential, respectively, as a result of restrictive land use policies. To address these challenges, Gottlieb proposes the adoption of state-level Minimum Zoning Mandates (MZMs) that would allow landowners to build at a state-guaranteed minimum density. He argues that such MZMs would not only improve housing affordability, but also spread economic opportunity more broadly and limit the environmental impact of new development. The American Jobs Plan highlights the problem of exclusionary zoning and calls for a federal competitive grant program that rewards jurisdictions that relax unnecessary barriers. This approach likely reflects constitutional limits of federal legislators to directly restrict local zoning regulations. However, as Gottlieb highlights, state-level policies may provide another promising avenue for reducing such restrictions.
  1. James Ziliak’s 2019 AESG report also discusses the barriers to increased economic opportunity in rural labor markets, highlighting the large urban-rural divide in U.S. employment and wage rates. He proposes a two-fold strategy of bringing “people to jobs” through policies such as relocation assistance payments and short-term credit for commuting expenses, and “jobs to people” by way of recurring loans and grants for small businesses and the creation of a federal jobs program. The Biden plan emphasizes the latter approach, with investments dedicated to increasing local innovation, supporting domestic manufacturers, and expanding access to broadband services, although it does not include a federal jobs program. Ziliak also underscores the importance of rural broadband access, noting that expanded telework both increases access to stable jobs and decreases congestion in high-density urban areas.
  1. In a 2020 AESG report, Timothy Bartik argues that large and persistent differences in employment rates across U.S. places highlight the need for local economic development policies to better promote cost-effective job creation in distressed areas. The vast majority of funding spent by state and local governments each year—roughly $47 billion—is allocated to tax breaks and financial incentives for specific firms.  Bartik recommends state-level policy reforms to direct resources to the most distressed areas, where the initial rate of employment is low. Bartik also recommends “export-based industry targeting,” which aims to promote local growth beyond the specific industries they target to create a multiplier effect in the local economy and avoid drawing business away from other local firms. Additionally, he highlights two potential federal interventions: capping the size of tax or other large discretionary incentives awarded by state or local governments; and a new federal block-grant program for local economic development that would be awarded to local labor markets that are 5 percentage points or more below the U.S. average in prime-age employment rates.


Inequality and the Middle Class


“President Biden is committed to strengthening and reforming the system for the long term. … [He] wants to work with Congress to automatically adjust the length and amount of UI benefits unemployed workers receive depending on economic conditions.”

“President Biden’s plan uses the resulting revenue to rebuild the middle class, investing in education and boosting wages. It will also give tax relief to middle-class families, dramatically reducing child poverty and cutting the cost of child care in half for many families.”

“Make the Earned Income Tax Credit Expansion for childless workers permanent.”

-American Families Plan Fact Sheet, 2021


Rebuilding the American middle class is a central theme of the Biden Administration’s Families Plan. Proposals such as free community college, an expanded EITC for childless workers, and new childcare benefits would increase redistribution to the middle class. When combined with the administration’s pledge to not raise taxes on families with annual incomes below $400,000, the plan would increase benefits without raising revenues from many middle-income families. 

  1. Despite prevailing political narratives, a 2020 AESG report from Adam Looney, Jeff Larrimore, and David Splinter shows that government tax and transfer policies have increasingly benefited the middle class since the 1970s. Their analysis also raises the question of whether future federal tax and transfer policies can continue to boost middle-class income without also increasing tax revenue from the middle class.
  1. In a 2018 AESG memo, Jason Furman and Phill Swagel weigh the pros and cons of two alternative policy approaches that aim to promote increased earnings for the lower and middle quintiles: (1) tripling the EITC among childless workers (based on 2017 levels); and (2) implementing a wage subsidy for low-income workers that would be administered through employers. The wage subsidy would be delivered through employers of low-income workers and would be based on hourly wages rather than annual household income. Another important difference is that the benefits to workers would be in the form of wage compensation which would require no filing or other administrative effort by workers. However, the implementation of a wage subsidy would need to be administered through state unemployment insurance (UI) systems, creating an administrative burden for states and employers.

The Covid-19 pandemic underscored the importance of the federal safety net for providing support for the unemployed, underemployed, and most vulnerable. However the pandemic also exposed weaknesses and gaps in the safety net, as program benefit amounts and payments were poorly timed with economic conditions. In response, the American Families Plan proposes implementing automatic adjustments to the length and amount of UI benefits depending on economic conditions. 

  1. AESG members Jason Furman, Timothy Geithner, Glenn Hubbard, and Melissa Kearney suggest reforming the UI system by automatically phasing in and out benefits based on economic circumstances, employing automatic triggers for UI extended benefits, along with bolstering short-time compensation benefits.


Photo Credit: Unsplash – Euan Cameron

How much have childcare challenges slowed the US jobs market recovery?

The US economy lost a net of 8 million jobs between February 2020 and April 2021. Agreement is growing that people not actively seeking employment (inadequate labor supply) has been playing a major role in the slow recovery, as evidenced by factors including record job openings, the largest wage increases in decades, and other signs of a tighter labor market than would generally be expected given the still low levels of employment. Why has labor supply been slow to return? There are many candidate explanations, including the ongoing worry among some adults about getting COVID if they return to the workplace, the increased availability and generosity of unemployment insurance benefits, and challenges for working parents associated with closed schools and inadequate childcare, among others. Diagnosing the sources of ongoing weak labor supply is important to inform the types of policies that are needed now to speed the recovery. 

In this analysis, we quantify the effect of childcare challenges on the labor market by examining how much of the overall decline in employment can be explained by excess job loss among parents, and mothers specifically. We do this by constructing counterfactual employment rates, or employment-population ratios, as well as labor force participation rates, that assign to parents with young children the percent change in employment and labor force participation rates experienced by comparable people without young children. The results of this exercise imply that differential job loss among parents, or even mothers specifically, accounts for a negligible share of aggregate job loss and could even have led to a small increase in jobs between the first quarters of 2020 and 2021. 

This analysis demonstrates that despite the widespread challenges that parents across the country have faced from ongoing school and daycare closures, excess employment declines among parents of young children are not a driver of continuing low employment levels. In fact, while women with young children have left the workforce at a slightly higher rate than other women, men with young children have left the workforce at a lower rate than men without. Overall, the employment rates of parents of young children have declined by 4.5 percent as compared with 5.2 percent among people that are not parents of young children (the decline is also smaller for parents of young children when adjusting for age differences between the two groups). 

Furthermore, this conclusion holds even if we consider only the excess declines in employment among mothers with young children without accounting for the offsetting effect among men. The reason why is twofold. First, women with young children account for only 12 percent of the workforce. Second, mothers with young children left the workforce by only slightly more than comparable women without young children. Combining these two facts means that any childcare issues that have pushed mothers out of the workforce accounts for a negligible share of the overall reduction in employment since the beginning of the pandemic adjusting only for age differences. The estimated amount of the overall decline in employment that can be explained by challenges particular to mothers of young children is even smaller (zero, in fact), if we adjust the comparisons between mothers of young children and other women to control for education and industry of work. 

School closings and ongoing childcare challenges have been a tremendous source of stress for parents during the pandemic. They are also likely to have lasting, negative impacts on the learning and social development of children. In this analysis, however, our focus is on the one specific, empirical question—how has parenting affected the aggregate employment numbers over the course of the pandemic. Instead, parents of young children have suffered about equally as others in the widespread and, in many cases, damaging employment losses that have occurred throughout the economy.


Employment declines among parents

Women with young children have experienced the greatest rate of job loss over the past year, which is descriptively consistent with the hypothesis that school closures and childcare struggles have lowered women’s work during the pandemic. Employment counts from the Current Population Survey in January, February, and March of 2020 and 2021 confirm that between the first quarter of 2020 and the first quarter of 2021, employment rates fell more for women with young children (defined as any own child under 13 in the household, including adopted children and stepchildren) than for all other women. Among all women, the employment rate fell by 5.7 percent (3.9 percentage points) for those with at least one child under 13, as compared with 5.0 percent (2.6 percentage points) for those without a child under 13. 

The pattern is reversed among men, with larger declines among men without young children than among men with young children. The employment rate fell by 3.3 percent (3.0 percentage points) for men with at least one child under 13, as compared with a decline of 5.3 percent (3.2 percentage points) for men without a child under 13. Though explaining this finding is beyond the scope of this analysis, one possible explanation is the substitutability of labor supply between parents. 

The gap in employment declines between mothers with young children and other women is driven by women without a bachelor’s degree. Figure 1 shows changes in the employment rates for individuals with any child under 13 and those without, separately for men and women with and without a bachelor’s degree. As can be seen in the figure, among women with a bachelor’s degree, there is no difference in the percent change in employment between mothers of young children and other women. But, among women without a bachelor’s degree, women with young children experienced a larger decline in employment, as compared with women without young children. This affected group comprised 6 percent of the overall employment in the first quarter of 2020.

Figure 1.

These comparisons are noteworthy, but they are not necessarily indicative of an effect of childcare struggles, school closures or other factors associated with parenting on employment declines, even for mothers without a bachelor’s degree. The reason is because women with and without young children differ on other dimensions that are related to employment outcomes, such as age, industry, marital status, income, and race and ethnicity We next turn to a counterfactual analysis to estimate how much of the decline in employment – both overall and for mothers in particular – is attributable to having a young child (and the associated challenges), adjusting for a range of factors. 


Counterfactual analysis: what if the pandemic labor market experience of parents with young children was like that of otherwise-similar people without young children? 

The heart of our analysis is a counterfactual: what would have happened to aggregate employment rates if parents with young children experienced the same rate of employment decline as individuals without young children? This provides a reasonable estimate of the potential role of factors that affect families with young children, especially school closures and lack of childcare.

The motivation for this exercise is the observation that the fact that millions of mothers have lost jobs or left the labor force is not, by itself, evidence that childcare, school closings, or other child-related reasons are to blame. Hypothetically, if employment rates or labor force participation rates fell by the same proportion for similar people with and without young children, primary causes of the decline are likely to be factors other than childcare challenges or school closures. In such a case, the source of the decline in employment among parents with young children would likely be something that was affecting everyone in a similar manner, such as workplaces being closed, jobs being undesirably unsafe, or unemployment insurance benefits being more generous and available.

A very simple, naive counterfactual exercise is to ask what would have happened to the overall employment rate if the employment of mothers with young children changed in the same way it did for women without young children. That is, what if women with young children only experienced a 5.0 percent decline in employment, instead of the 5.7 percent decline they actually did? Given that mothers with young children were 12 percent of total employment at the beginning of 2020, this would have resulted in the aggregate employment rate falling by 0.05 percentage point, less than the 3.1 percentage points it actually did. If we apply this counterfactual calculation to both mothers and fathers with young children, the decline in employment would have been even larger than actually observed. 

The naive counterfactual ignores the myriad ways that people with and without young children are different, including their age and education profiles and the industries they tend to work in. For instance, if women with young children are more likely to be young or work in industries that still have high levels of job loss, then what looks like a disparate impact of having young children during the pandemic, might actually reflect different rates of job loss for young and older workers or for workers in certain industries.

Our baseline counterfactual accounts for some basic demographic differences between people with and without a child under 13. Specifically, we collapse the data into cells defined by sex, four age groups, and whether someone has a bachelor’s degree. For each sex-age-education cell, we calculate what employment would have been if those with a child under 13 experienced the same percent change in employment as those in the same sex-age-education cell but who did not have a child under age 13. This allows us to compare parents of young children to otherwise similar individuals. We use the same methodology for labor force participation.

 Table 1 reports the results of this baseline counterfactual calculation. This calculation implies that the effect of any excess impact of the pandemic on parents with young children can explain none of the decline in aggregate employment rates. In fact, this calculation implies there would have been even more jobs loss if parents of young children experienced the same employment decline as similar people without a young child, on account of fathers with young children experiencing relatively less employment loss than other men. If we only do the counterfactual calculation for women, the excess effect of the pandemic on mothers with young children can explain 2 percent of the aggregate employment rate change. Looking at the full childcare situation facing families, the sign flips, meaning the excess job loss among parents of young children can explain -2 percent of the aggregate employment-to-population decline.

Table 1: Change in employment and labor force participation rates, observed and simulated under counterfactual scenario assuming no disproportionate effect on adults with children under age 13

Note: Under baseline counterfactual, individuals with a child under age 13 are assigned the percent change in the employment rate or labor force participation rate as individuals without a child under age 13 within the same sex, educational attainment (bachelor’s degree vs. not), and age (16-24, 25-39, 40-54, 55+) group. Percentage points denoted p.p..
Source: Bureau of Labor Statistics, Current Population Survey via IPUMS CPS; authors’ calculations.

Table 2 presents the results of numerous alternative counterfactual constructions, in addition to the baseline counterfactual and the naive unadjusted counterfactual, in order to examine the robustness of the baseline counterfactual finding. The top panel reports results from changing the age cutoff of children, looking alternately at parents of children less than age 6 or less than age 18. As shown in the top panel of the table, the qualitative conclusions are not dependent on age cutoff. If we consider the excess impact on mothers with children less than 6, the share of the aggregate employment decline that can be explained is 0 percent under the baseline counterfactual; if we consider the excess impact on mothers with children less than 18, the share that can be explained is 1 percent under the baseline counterfactual.

Table 2: Change (in p.p.) in employment and labor force participation rates,
simulated under alternative counterfactual approaches

Source: Bureau of Labor Statistics, Current Population Survey via IPUMS CPS; authors’ calculations.

Next, we construct the counterfactual changes with different sets of demographic adjustments. We redefine the sets of demographic characteristics used for comparisons to alternately exclude education, to include industry, to include marital status, to include income group, and to include race/ethnicity. This allows us to compare parents of young children to people who are similar along various different dimensions. 

As a conceptual matter, defining cells based on age, education, and industry seems the most appropriate to us but we do not make it our baseline in order to be conservative. For example, to the extent that mothers with young children tend to work in a different set of industries than women without young children – even conditional on age and college-degree attainment – they would have experienced a differential degree of job loss. Constructing the counterfactual employment numbers adjusting for age, educational attainment, and industry implies a change in employment of 0.00 percentage point attributable to women, which can account for none of the total employment-to-population decline. The fact that the estimated share explains goes to zero when industry is included indicates that much of the variation between women with children and without (adjusted for age and education) is driven by the fact that women with children are disproportionately working in industries that faced greater declines. 

For each different demographic adjustment we consider, the simulated change in the employment rate from assigning mothers with young children the corresponding change in employment of comparable women without young children is very small, below 0.10 percentage points across all counterfactuals, explaining at most 3 percent of the total decline in the overall employment rate. 

One concern with these counterfactuals might be that to the extent that all women – including those without young children – disproportionately experienced caregiving burdens that reduced their employment, assigning the employment changes of women without young children to the employment changes of women with young children still incorporates caregiving burdens into the simulated effect. To address this concern, we consider a different counterfactual approach that assigns women with young children the change in employment experienced by similar men without young children. As with the results of the other alternative counterfactuals reported in Table 2, this counterfactual still leads to the conclusion that differential employment changes for mothers with young children explain very little of the total change in employment.  

While our discussion has primarily focused on the effects of parenting on employment, the same series of counterfactual exercises show similar results for labor force participation. Our results indicate that differential declines in labor force participation for parents of young children explains essentially none of the 1.7 percentage point decline in the labor force participation rate between the first quarter of 2020 and the first quarter of 2021. For mothers of young children, differential declines in labor force participation can explain, at most, 0.10 percentage point, or 6 percent, of the total decline. Results for full-time employment are similarly small, and, if anything, generally indicate that full-time employment would have been slightly lower if parents of young children experienced the same change in full-time employment rates as individuals without young children.

We also tried to find direct evidence for the impacts of school closures. One method was to compare states that had above and below median rates of in-person schooling (according to this tracker) as of early May 2021. States with below median in-person schooling had larger percent reductions in employment rates for almost all groups by sex and educational attainment—whether or not they had young children—consistent with these states either having more serious problems with the virus or a greater level of mandatory or culturally-induced social distancing. The differences between people with and without young children were not, however, systematically different in states with below median in-person schooling.

We also estimated regression models to obtain the conditional estimated impact of having a young child on employment rates for men and women in places with below median rates of in-person schooling as of early May 2021. The estimated regression coefficients do not show an excess negative effect on employment for men or women with young children in places with relatively low rates of in-person instruction. These results bolster our confidence in the results of our counterfactual analysis.

Finally, we also examined the patterns of employment losses specific to parents in the 2001 and 2007-09 recessions. We found that they were similar to the patterns observed over the past year. This suggests that there has not been something very different about how the pandemic and associated school and daycare closings have differentially affected the labor market outcomes of parents with young children relative to other workers who have also experienced the adverse impacts of the combination of the pandemic and associated recession.


Conclusion

Our examination of data on employment declines among parents with young children and others over the course of the pandemic suggests that overall, parents of young children did not leave the workforce substantially more than other comparable individuals. We constructed counterfactual estimates of what employment declines would have been if mothers and fathers with young children experienced the same change in employment as comparable people without young children. These estimates indicate that a negligible share of the overall decline in employment can be attributed to challenges specific to parents with young children. 

While school closures and ongoing childcare challenges have substantially burdened parents and children alike, they do not appear to be a meaningful driver of the slow employment recovery. This means that the factors responsible for the slow employment recovery and depressed labor supply are issues that are not exclusively related to the struggles of working parents, such as the continued concern about the threat of getting COVID at work or expanded unemployment insurance benefits and eligibility. 

Furthermore, the fact that aggregate job losses do not appear to be explained by excess job losses among mothers with young children (after accounting for other factors like age, education, and industry) does not mean that mothers with young children have not been especially burdened over the past year. The fact that these women did not disproportionately retreat from the workforce in substantially larger numbers, while shouldering increased childcare and educational responsibilities for their children, might very well be an indication of excess burden that represents a shortcoming of the safety net established to respond to the COVID crisis.

Data Disclosure:

The data underlying this analysis are available here.

This post was co-produced with the Peterson Institute for International Economics (PIIE). Jason Furman is a nonresident senior fellow at PIIE; Wilson Powell III is a research associate at the Harvard Kennedy School. Copyright Peterson Institute for International Economics; re-posted with permission. 


Photo credit: Unsplash – Vitolda Klein

Biden should embrace a carbon tax

President Biden deserves credit for his actions to date on climate change. In rejoining the Paris agreement, directing new energy standards, pushing for bold congressional action, convening world leaders and announcing dramatic emissions reduction targets, he is showing that American climate leadership is back. But there is one major climate policy arena where the United States needs to take a bold step forward: carbon pricing.

carbon tax, which taxes carbon dioxide and other greenhouse-gas emissions, is a proven means to raise large sums of much-needed revenue while read more in The Washington Post

Aspen Economic Strategy Group welcomes seven new members

New members replace outgoing Biden-Harris administration appointees and include Atlanta Fed President & CEO Raphael Bostic and former U.S. Treasury Secretary Jacob Lew.

The Aspen Economic Strategy Group (AESG) today announces seven new members to the sixty-five member, invitation-only group made up of distinguished leaders and thinkers who share the goal of promoting evidence-based solutions to significant challenges confronting the American economy.  Established in 2017, the AESG is co-chaired by Henry M. Paulson, Jr., former secretary of the U.S. Treasury and chairman of Goldman Sachs, and Erskine Bowles, former White House chief of staff to President Bill Clinton and president of the University of North Carolina system.

The bipartisan group fosters the exchange of economic policy ideas and seeks to clarify the lines of debate on emerging economic issues while promoting bipartisan relationship building among current and future generations of policy leaders. Members are drawn from the civic, business, academic, and public sectors and share a commitment to policy making based on facts and evidence, respectful disagreement, and principled compromise.

New members include:

Raphael W. Bostic
President and Chief Executive Officer, Federal Reserve Bank of Atlanta

Susan M. Collins
Provost and Executive Vice President for Academic Affairs, University of Michigan

Michael Froman
Vice Chairman and President, Strategic Growth, Mastercard

Vickee Jordan Adams
Partner, Finsbury Glover Hering, Financial Services Co-Leader

Jacob J. Lew
Managing Partner, Lindsay Goldberg; Visiting Professor of International and Public Affairs, Columbia University

Matthew J. Slaughter
The Paul Danos Dean of the Tuck School of Business; Earl C. Daum 1924 Professor of International Business, Dartmouth College

Michael R. Strain
Director, Economic Policy Studies; Arthur F. Burns Scholar in Political Economy, American Enterprise Institute

Five members recently departed to serve in the Biden-Harris administration, including Deputy Treasury Secretary nominee Adewale Adeyemo, NEC Director Brian Deese, White House Deputy Chief of Staff Bruce Reed, Treasury Secretary Janet Yellen, and Jeffrey Zients, who heads the White House COVID-19 response team.

“We are thrilled to welcome these new members, who bring a wide range of expertise and experience,” said Director Melissa S. Kearney who is also an AESG member and the Neil Moskowitz Professor of Economics at the University of Maryland. “There is no shortage of economic challenges facing our country. In today’s hyperpolarized political climate, the AESG’s ability to convene a bipartisan group of leaders who share a commitment to evidence-based policy solutions is rare but essential for building a stronger and more equitable economy.”

The full list of Aspen Economic Strategy Group members may be viewed here

New Member Biographies


Raphael W. Bostic

President and Chief Executive Officer, Federal Reserve Bank of Atlanta


RAPHAEL W. BOSTIC is the 15th president and chief executive officer of the Federal Reserve Bank of Atlanta, which serves the Sixth Federal Reserve District covering Alabama, Florida, and Georgia, and parts of Louisiana, Mississippi, and Tennessee. He is responsible for all of the Bank’s activities, including monetary policy, bank supervision and regulation, and payment services. He is also a member of the Federal Open Market Committee.

Prior to the Atlanta Fed, Bostic served as the Judith and John Bedrosian Chair in Governance and the Public Enterprise at the Sol Price School of Public Policy at the University of Southern California (USC). His research interests include home ownership, housing finance, neighborhood change, and the role of institutions in shaping policy effectiveness. While at USC, he served as director of the master of real estate development degree program and was the founding director of the Casden Real Estate Economics Forecast. Bostic also served as interim director of the USC Lusk Center for Real Estate and chaired the center’s Governance, Management, and Policy Process department.

Bostic has held a number of government and non-profit leadership roles, including as assistant secretary for policy development and research at the U.S. Department of Housing and Urban Development (HUD).

Bostic holds a bachelor’s degree from Harvard and a doctorate in economics from Stanford University.


Susan M. Collins
Provost and Executive Vice President for Academic Affairs, University of Michigan


SUSAN M. COLLINS is provost and executive vice president for academic affairs at the University of Michigan, and is the Edward M. Gramlich Collegiate Professor of Public Policy and professor of economics. She served as the Joan and Sanford Weill dean of Michigan’s Gerald R. Ford School of Public Policy from 2007 to 2017.  Dr. Collins is a member of the Federal Reserve Bank of Chicago Board of Directors and a board member of the National Bureau of Economic Research and the Peterson Institute for International Economics.  She has served as President of the Association of Professional Schools of International Affairs, and as chair of the American Economic Association’s Committee on the Status of Minority Groups in the Economics Profession.  Prior to joining Michigan’s faculty, Dr. Collins was professor of economics at Georgetown University and senior fellow in the Economic Studies Program at the Brookings Institution.  She received a B.A. in economics in 1980 from Harvard University (summa cum laude) and a Ph.D. in economics in 1984 from the Massachusetts Institute of Technology.


Michael Froman
Vice Chairman and President, Strategic Growth, Mastercard


MIKE FROMAN serves as vice chairman and president, Strategic Growth for Mastercard. In that role he is responsible for growing strategic partnerships, scaling new business opportunities, and advancing the company’s efforts to partner with governments and other institutions to address major societal and economic issues. He and his team drive financial inclusion and inclusive growth efforts and work to develop new businesses key to the company’s strategic growth. Mike is chairman of the Mastercard Center for Inclusive Growth and is a member of the company’s management committee.

Prior to joining Mastercard, Mike was affiliated with the Council on Foreign Relations and continues to serve as a distinguished fellow. In September 2018, Mike joined the Board of Directors of The Walt Disney Company.

From 2013 to 2017, Mike served as the U.S. Trade Representative, President Barack Obama’s principal advisor and negotiator on international trade and investment issues. During his tenure, Mike worked to open foreign markets for U.S. goods and services, reach landmark trade agreements and enforce the rights of American workers, farmers and firms. From 2009-2013, he served at the White House as assistant to the President and deputy national security advisor for international economic affairs.

Prior to joining the Obama Administration, Mike held several executive positions at Citigroup, including CEO of its international insurance business, COO of its alternative investments business and head of its infrastructure and sustainable development investment business. He helped shape the company’s strategy in China, India, Brazil and other emerging markets. Earlier in his career, during the Clinton Administration, he worked at the White House and the Treasury Department.

Mike received a bachelor’s degree in public and international affairs from Princeton University, a doctorate in international relations from Oxford University, and a law degree from Harvard Law School, where he was an editor of the Harvard Law Review.


Vickee Jordan Adams
Partner, Finsbury Glover Hering, Financial Services Co-Leader


VICKEE JORDAN is a Partner at Finsbury Glover Hering, with decades of experience in reputation and risk management. She is co-leader of Financial Services client engagements, navigating responses to shareholder demands, investigative reporting or events associated with public offerings. Whether brand building with integrated marketing campaigns or conducting advocacy events for underserved consumer needs, Vickee’s reputation for providing wise counsel and memorable feedback is highly regarded.

Prior to joining Finsbury Glover Hering, Vickee led national media relations for Wells Fargo Home Mortgage and its Consumer and Small Business Banking division. She led Consumer Lending’s Responsibility Center for the LIBOR transition and increased awareness for housing policy reform by enhancing the bank’s relationships with real estate trade groups and federal housing authorities. Her team navigated and placed numerous national media inquiries.

Previously at H&K and Ketchum, Vickee counseled financial services teams at J.P. Morgan Chase, Standard & Poor’s, Citi, AIG and The Federal Reserve, offering guidance on congressional testimony and quarterly reporting. Known for her attention to confidentiality, Vickee advised highly placed executives and offered insight into sensitive, complex transactions. As Director of Communications for Dow Jones & Company, Vickee was the spokesperson for the Wall Street Journal.

A frequent diversity and inclusion moderator or panelist, Vickee is a University of Pennsylvania graduate, and a founding member of Count Me In for Women’s Economic Independence and served as a board Trustee for Granite Broadcasting, WNYC and Iowa Public Radio.


Jacob J. Lew
Managing Partner, Lindsay Goldberg; Visiting Professor of International and Public Affairs, Columbia University


JACK LEW served as the 76th United States Secretary of the Treasury from 2013 to 2017. Previously, he served as White House Chief of Staff to President Barack Obama and Director of the Office of Management and Budget in both the Obama and Clinton Administrations.   He has also served as Deputy Secretary of State and as principal domestic policy advisor to House Speaker Thomas P. O’Neill, Jr, in addition to holding a variety of private sector and nonprofit roles.  Jack is currently a Managing Partner at Lindsay Goldberg and a member of the faculty at the School of International and Public Affairs at Columbia University.


Matthew J. Slaughter
The Paul Danos Dean of the Tuck School of Business; Earl C. Daum 1924 Professor of International Business, Dartmouth College


MATTHEW J. SLAUGHTER is the Paul Danos Dean of the Tuck School of Business at Dartmouth, where in addition he is the Earl C. Daum 1924 Professor of International Business. He is also a member of the American Academy of Arts and Sciences, a life member of the Council on Foreign Relations, a Research Associate at the National Bureau of Economic Research, a member of the academic advisory board of the International Tax Policy Forum, and an academic advisor to the McKinsey Global Institute.

From 2005 to 2007, Dean Slaughter served as a Member on the Council of Economic Advisers in the Executive Office of the President. In this Senate-confirmed position he held the international portfolio, advising the President, the Cabinet, and many others on issues including international trade and investment, currency and energy markets, and the competitiveness of the U.S. economy. He has also been affiliated with organizations including the Federal Reserve Board, the International Monetary Fund, the World Bank, the Congressional Budget Office, and the National Academy of Sciences.

Dean Slaughter’s area of expertise is the economics and politics of globalization. Much of his recent work has focused on policy responses to the World Financial Crisis; on the global operations of multinational firms; and on the labor-market impacts of international trade, investment, and immigration.


Michael R. Strain
Director, Economic Policy Studies; Arthur F. Burns Scholar in Political Economy, American Enterprise Institute


MICHAEL R. STRAIN is Director of Economic Policy Studies and Arthur F. Burns Scholar in Political Economy at the American Enterprise Institute. An economist, Dr. Strain’s research focuses on labor economics, public finance, and social policy, and his papers have been published in academic and policy journals. He is the author of the recently published book, “The American Dream Is Not Dead: (But Populism Could Kill It),” which examines longer-term economic outcomes for workers and households. He is the editor of the book “The US Labor Market: Questions and Challenges for Public Policy” and the coeditor the book “Economic Freedom and Human Flourishing: Perspectives from Political Philosophy.” He is a research fellow with the Institute for the Study of Labor (IZA) in Bonn. He was a member of the AEI-Brookings Working Group on Poverty and Opportunity, which published the report “Opportunity, Responsibility, and Security: A Consensus Plan for Reducing Poverty and Restoring the American Dream.” He also writes frequently for popular audiences, and his essays and op-eds have been published by The New York Times, The Wall Street Journal, The Washington Post, The Atlantic, and National Review, among others. He is a columnist for Bloomberg Opinion. A frequent guest on radio and television, Dr. Strain is regularly interviewed by broadcast news networks, including CNBC, MSNBC, and NPR. He has testified before Congress and speaks often to a variety of audiences. Before joining AEI, Strain worked at the U.S. Census Bureau and the Federal Reserve Bank of New York. He holds a Ph.D. in economics from Cornell, and lives in Washington.