Rising Childlessness is Driving the Decline in Birth Rates in the United States

The United States has experienced a dramatic decline in birth rates, starting in 2007 and continuing through recent years. This post updates and expands on findings in Kearney, Levine, Pardue (2020), The Puzzle of Falling Birth Rates in the United States, which concludes that the decline in birth rates has been fueled more by a higher frequency of women having zero children than by women having smaller families.
As shown in Figure 1, the overall birth rate in the US, defined as the total number of births per thousand women aged 15-44, has fallen from a recent high of 69.3 in 2007 to 56.0 in 2022. In recent years, the birth rate dropped from 58.3 births in 2019 to 56.0 in 2020 (a drop that Kearney and Levine (2021) contribute to COVID and that seems to be bigger for second births), before rebounding slightly to 56.3 in 2021 and ultimately returning to that multi-decade low of 56.0 in 2022.
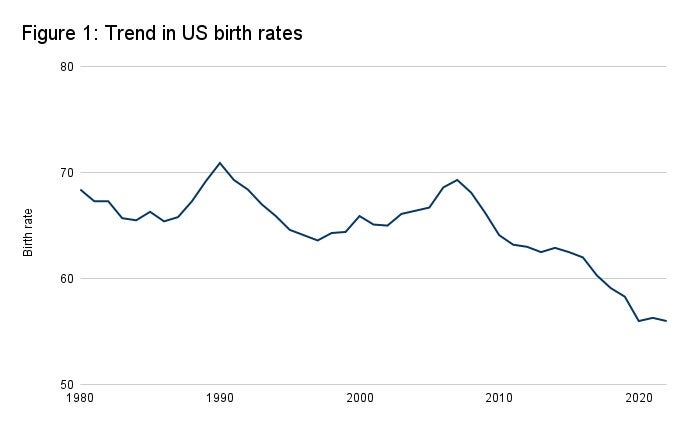
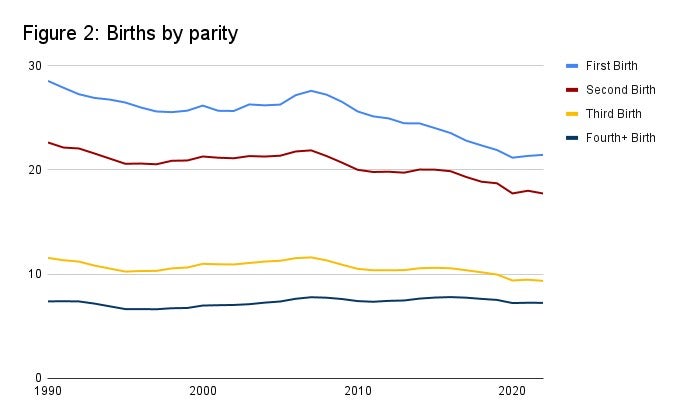
Figure 2 extends data in Kearney, Levine, Pardue (2020), charting birth rates by parity (birth order). From 2007 to 2022, first births declined from a rate of 27.6 per 1,000 women aged 15-44 to 21.5, a drop of 6.2 births. Second births declined from 21.9 to 17.7, a drop of 4.1 births. The birth rate for third-order declined by 2.3 from 11.6 to 9.3. Fourth or higher order births fell by 0.5 births. Although first, second, and third-order births declined by similar proportions (22%, 19%, and 20% drops, respectively), in absolute terms the drop of 6.2 first births can account for about half of the 13.3 total decline in birth rates over that period.
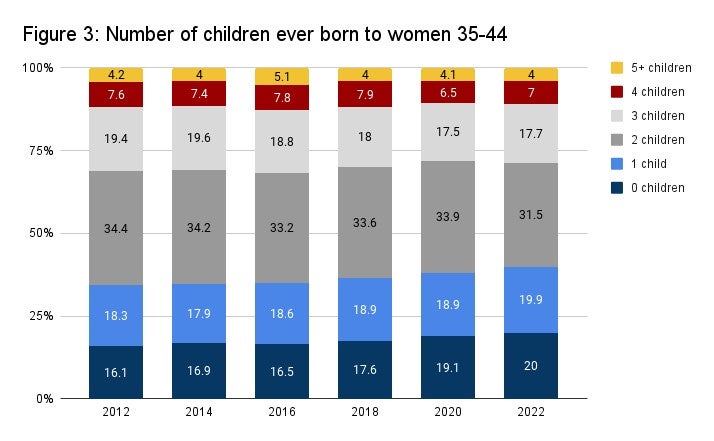
The rise of childlessness is also apparent in recent survey data. Figure 3 plots data from the Current Population Survey’s June Fertility Supplement. The share of women ages 35-44 reporting zero children ever born has risen from 16.1% in 2012 to 20% in 2022. Women reporting 1 or more children born rose 1.6 percentage points, and every other group (2 children, 3 children, 4 children, and 5 or more children) declined or were relatively flat over this period. Furthermore, the rise in women 35-44 reporting no children ever born is seen across nearly every demographic group – by family income, race and ethnicity, geography, and employment status.
Kearney, Levine, and Pardue (2020) find little evidence of a relationship between the decline in fertility and recent policy or economic changes over that period. This shift, instead, is likely a reflection of changing priorities of recent cohorts of US women, including life aspirations and preferences for having children.
Regardless of the cause, Kearney and Levine note in a 2020 AESG policy paper that these demographic trends pose a significant headwind to future economic growth. Should the drop in fertility continue, the US working-age population will decline within the next decade, leading to a smaller labor force and slower growth; second, an older workforce could drive lower innovation and productivity growth; finally, the imbalance between younger and older workers would further strain entitlement programs, such as Social Security and Medicare, which rely on taxes paid by current workers to fund benefits for older retirees.