Technological Disruption in the US Labor Market

DAVID DEMING, CHRISTOPHER ONG, LAWRENCE H. SUMMERS

Download Paper Executive Summary

Data Appendix

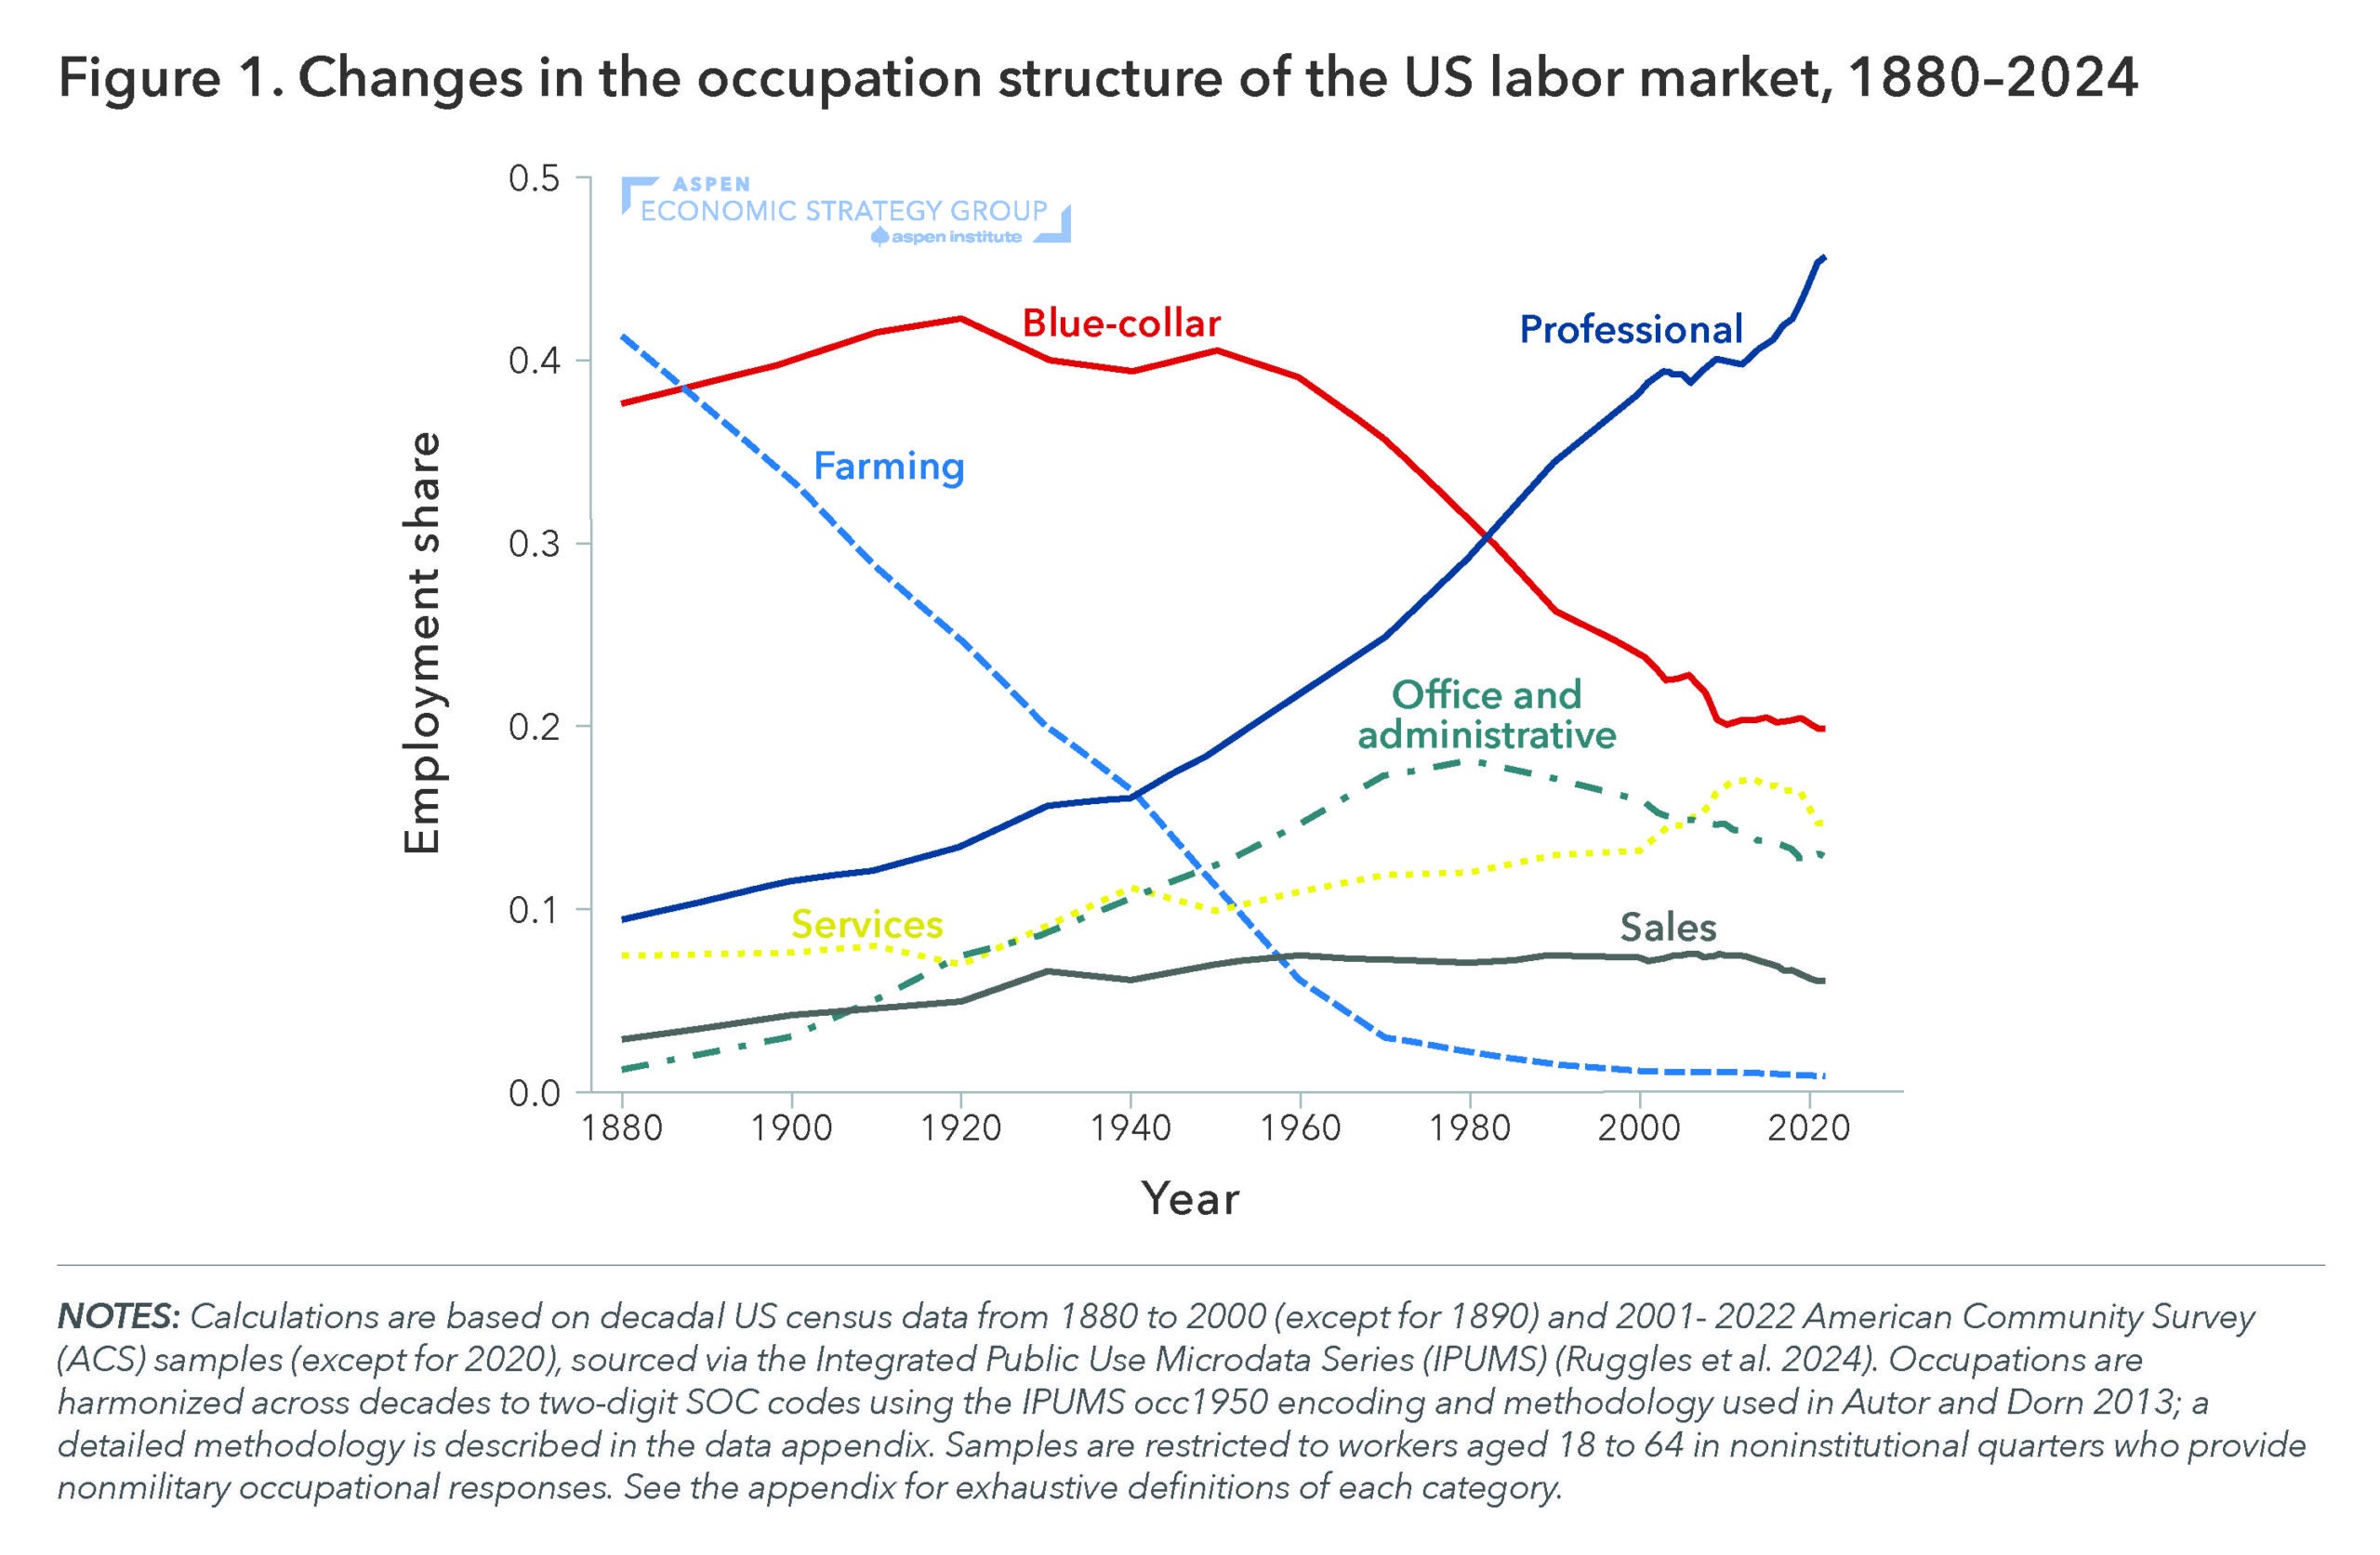
This paper explores past episodes of technological disruption in the US labor market, with the goal of learning lessons about the likely future impact of artificial intelligence (AI). The authors measure changes in the structure of the US labor market going back over a century in two ways. First, they examine the relative frequencies of occupations from 1880-2020. Over that period, the structure of the US labor market underwent two large shifts: 

  1. From 1880 to 1960, workers moved out of agriculture jobs. In 1880, 41 percent of all workers in the US economy were employed as farmers or farm laborers. This share fell consistently by 4 percentage points per decade, and by 1960 only 6 percent of US employment was in agriculture. 
  2. From 1960 to 1980, jobs moved from the factory to the office. The share of workers employed in blue-collar jobs like manual labor, construction, production and manufacturing, transportation, and maintenance and repair remained relatively constant at 40 percent from 1880 to 1960, then fell ten percentage points by 1980. It has experienced a slower decline since, reaching 20 percent by 2010.

They also find that the pace of change, as measured by occupational churn, has slowed over time: the years spanning 1990 to 2017 were less disruptive than any prior period we measure, going back to 1880. This comparative decline is not because the job market is stable today but rather because past changes were so profound. 

These changes were caused by general-purpose technologies (GPTs), like steam power and electricity, which dramatically disrupted the twentieth-century labor market over the course of several decades. The authors argue that AI could be a GPT on the scale of prior disruptive innovations and suggest that there are two patterns in the data that might indicate that AI is leading to labor market disruptions along the lines of past GPTs. First, increased investment in new technologies and a J-curve pattern of productivity growth in AI-exposed sectors. Second, large but steady declines in employment share for AI-exposed jobs, especially jobs in sectors where consumers don’t increase consumption with rising income. They present early evidence of such signs in four stylized facts:

  1. The labor market is no longer polarizing— employment in low- and middle-paid occupations has declined, while highly paid employment has grown. 
  2. Employment growth has stalled in low-paid service jobs. 
  3. The share of employment in STEM jobs has increased by more than 50 percent since 2010, fueled by growth in software and computer-related occupations. 
  4. Retail sales employment has declined by 25 percent in the last decade, likely because of technological improvements in online retail. 

The authors conclude that, with respect to white collar-jobs, AI will contribute to the ongoing decline in back-office administrative jobs and rise in management and business operations occupations. As AI technology improves, innovations like pricing algorithms and automated scheduling may lead to declining employment in sales and administrative-support occupations. On the other hand, while AI helps with certain tasks of professional and managerial workers, the demand for good ideas and cogent analysis of complex counterfactual thought experiments may be nearly unlimited. In this way, at least in the near term, AI is more likely to ratchet up firms’ expectations of knowledge workers than it is to replace them.

Suggested Citation: Deming, David, Christopher Ong, and Lawrence H. Summers. 2024. “Technological Disruption in the US Labor Market” In Strengthening America’s Economic Dynamism, edited by Melissa S. Kearney and Luke Pardue. Washington, DC: Aspen Institute. https://doi.org/10.5281/zenodo.13973975.

Protectionism is Failing and Wrongheaded: An Evaluation of the Post-2017 Shift toward Trade Wars and Industrial Policy

Download Paper Executive Summary

This paper evaluates the shift towards increasingly protectionist and nationalist policies carried out by the past two presidential administrations. In this paper, Michael Strain argues that the turn to such economic policies has not only been ineffective by its own standards, failing to raise employment and reduce America’s reliance on China, but also is more fundamentally misguided. Strain makes three central arguments about the efficacy of these increasingly insular economic policies. 

1. Protectionism Has Not Met Its Own Goals

The 2018-2019 tariffs likely reduced manufacturing employment. Increased prices of intermediary goods and retaliatory tariffs outweighed the protection from import competition, leading to net reductions in manufacturing employment. Research shows that industries more exposed to tariff increases experienced greater declines in employment. Beyond the manufacturing sector, counties with higher exposure to tariffs experienced higher unemployment rates.

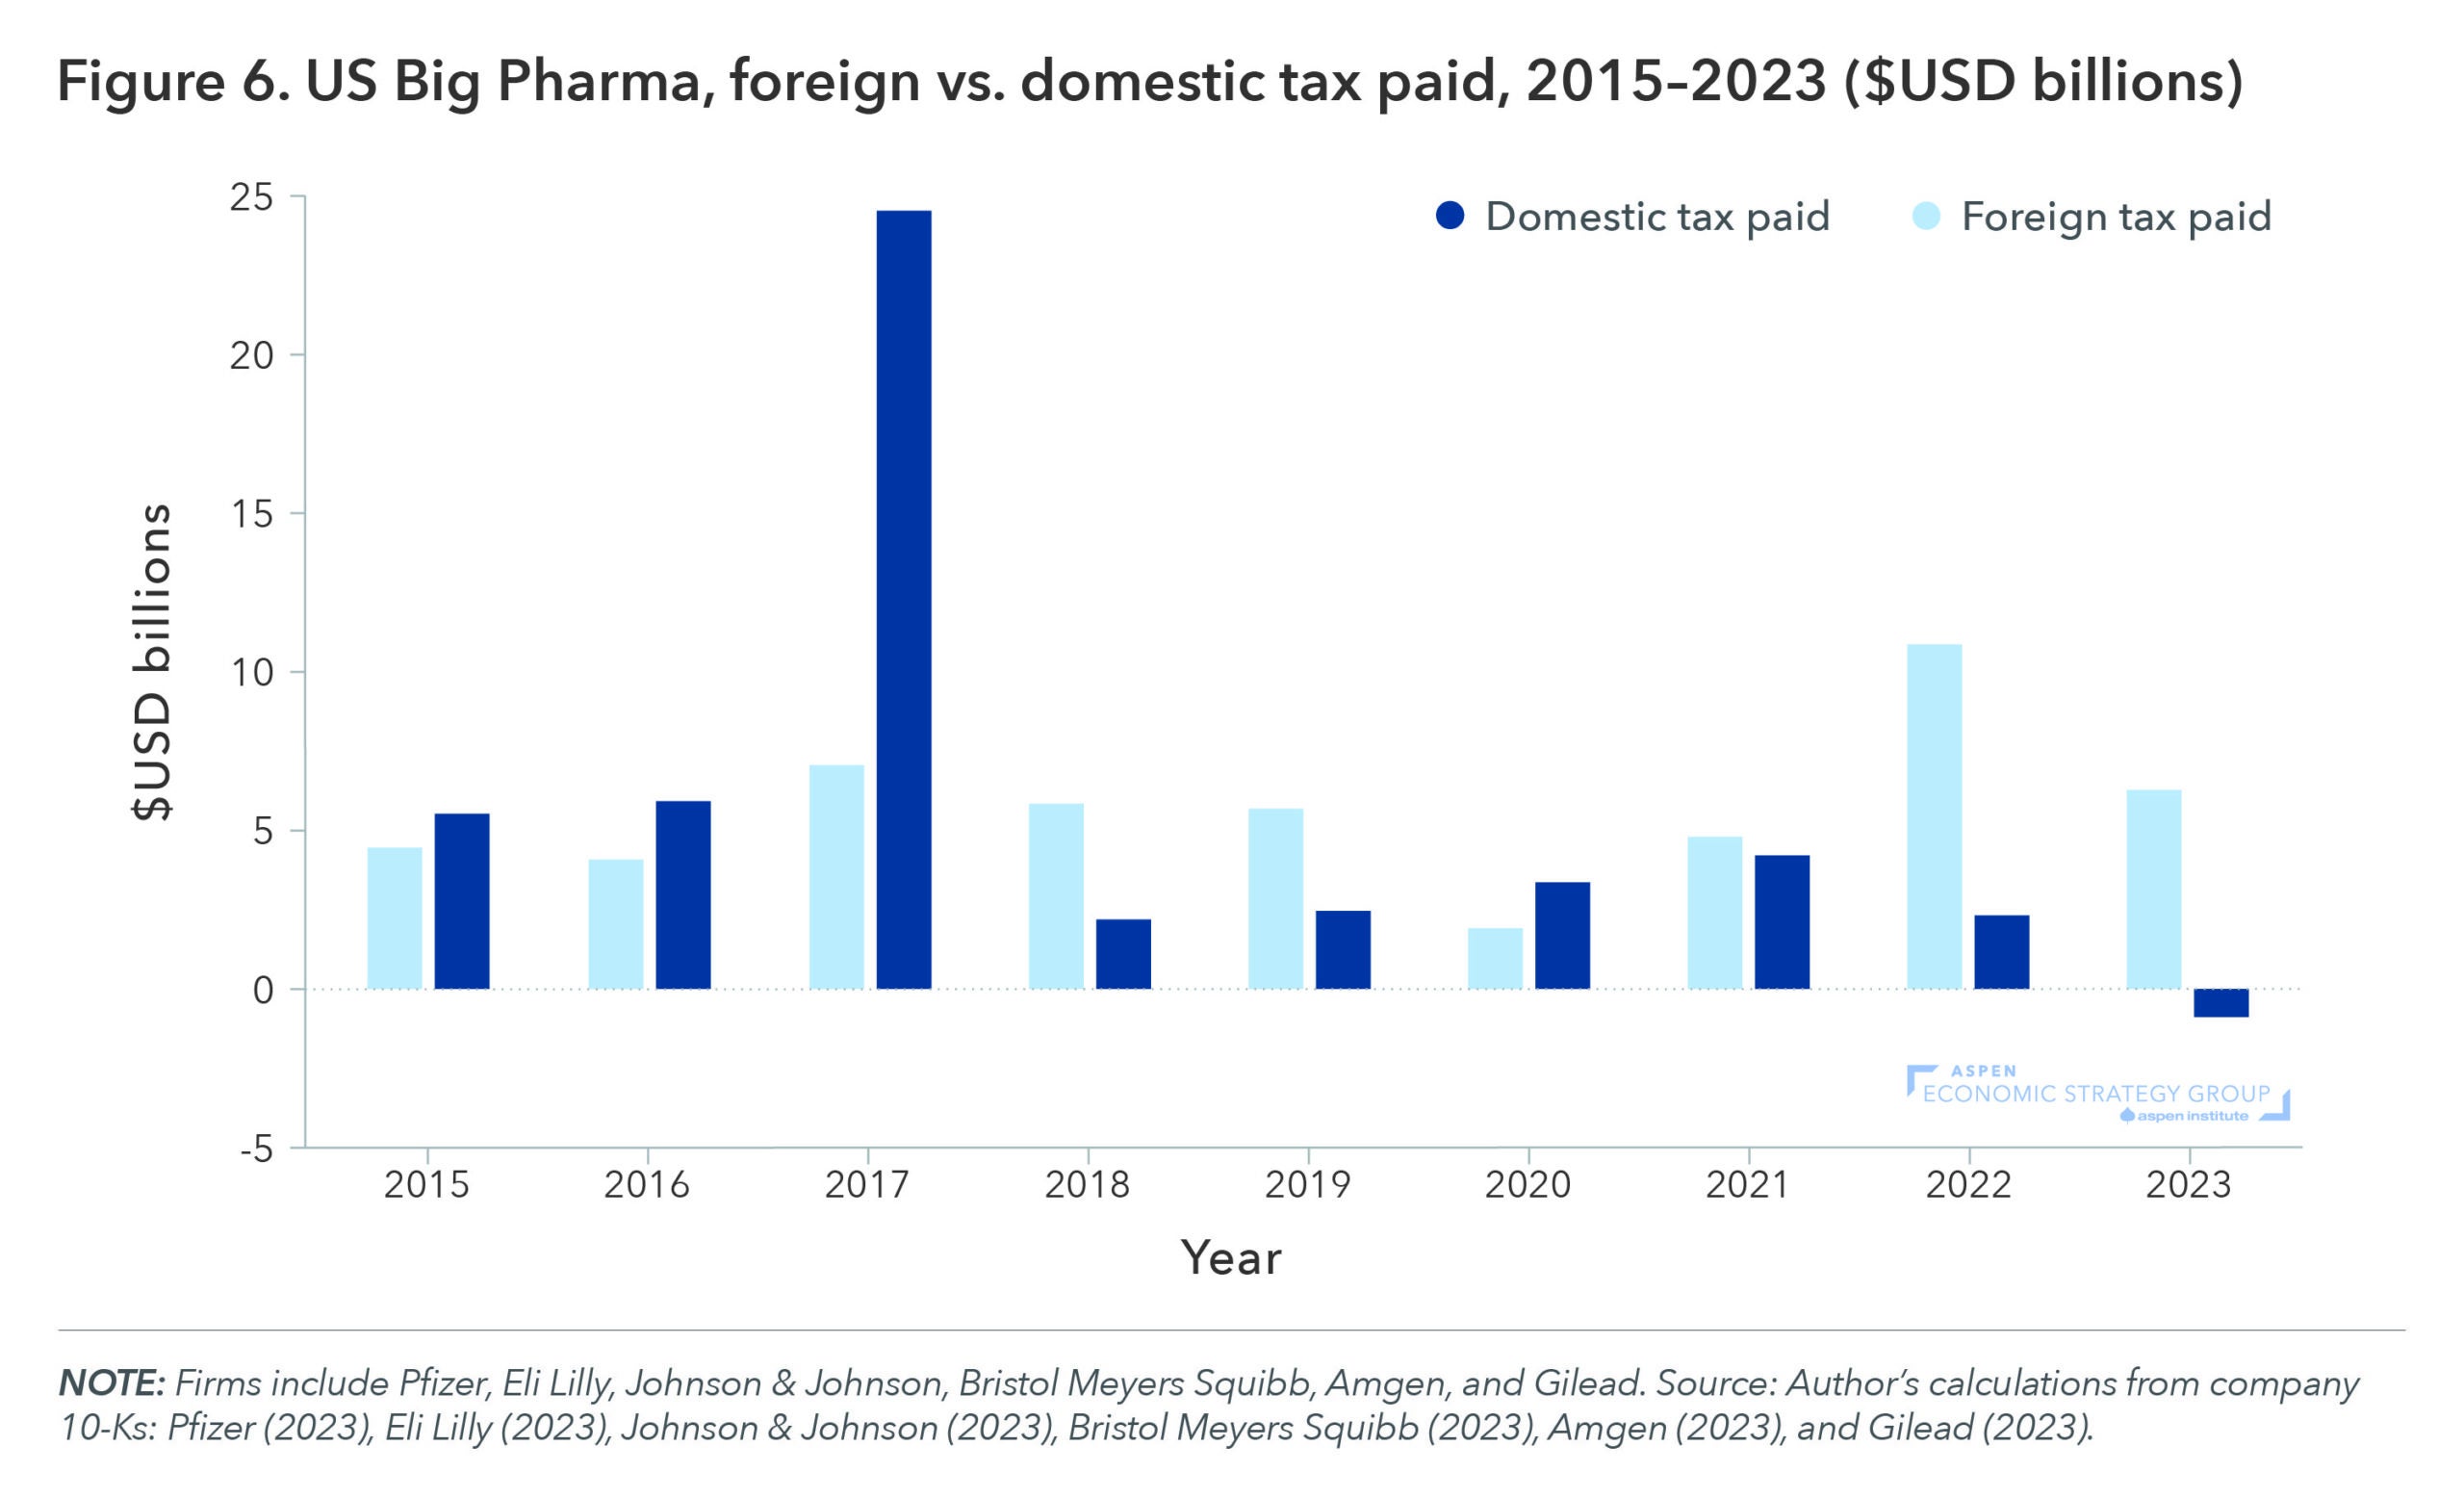
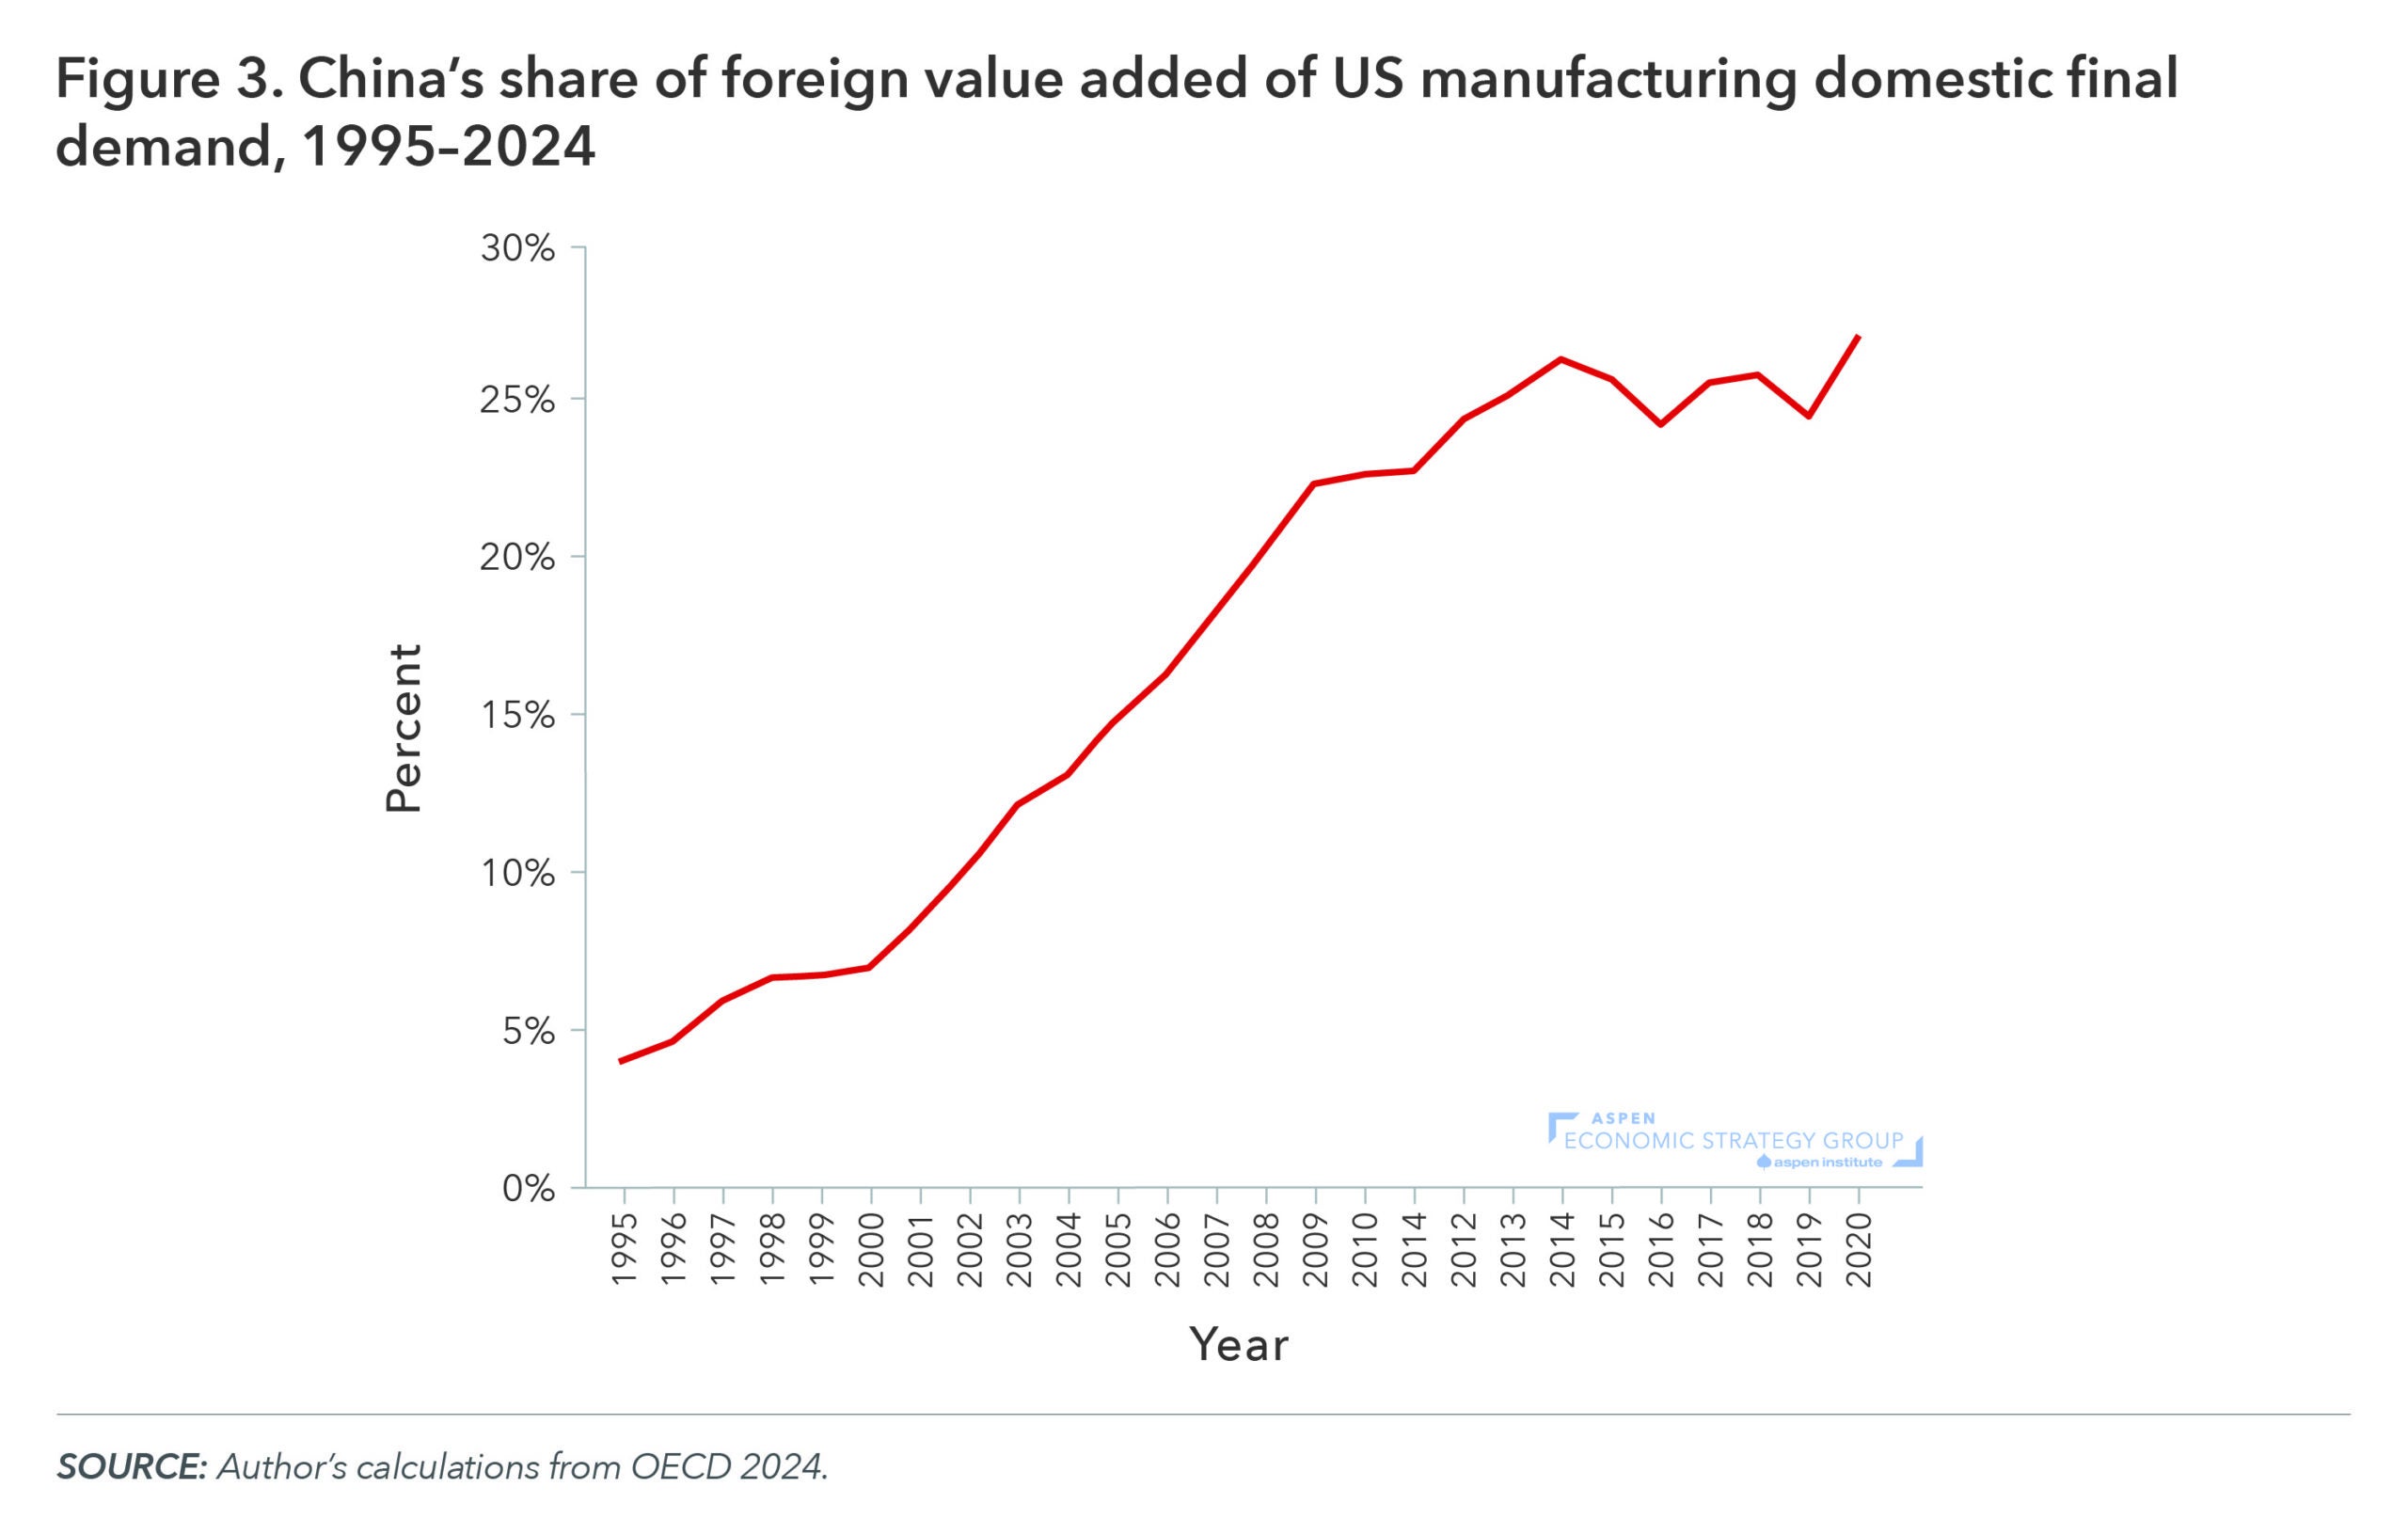
Post-2017 protectionism failed to reduce the US trade deficit, despite it being a primary goal of the Trump administration. The current account deficit rose from $85.5 billion when President Trump took office to $180 billion at the end of his term. Furthermore, many Chinese manufacturers rerouted goods through other nations, such as Mexico and Vietnam, to evade US tariffs. Thus, China’s “value-added” to US domestic final demand rose over the period, making the policy unsuccessful in reducing US reliance on Chinese imports. 

2. Protectionism is Wrongheaded

Strain argues that the goal of significantly increasing manufacturing employment is inherently misguided, as the decline in US manufacturing jobs largely reflects a productivity increase. Although these productivity gains have been accompanied by disruptions, they also have created new opportunities. Policymakers should focus on doing more to help affected workers access these new opportunities rather than trying to turn back the clock. 

Strain notes that trade creates both winners and losers by affecting the composition of jobs in the labor market, but should not affect the aggregate level of employment. Trade between nations allows a given country to specialize in the production of those goods and services for which that nation has a comparative advantage, and to trade to receive and consume other goods and services. However, trade is not about jobs, per se. Rather, trade is about productivity, wages, and consumption.

3. Industrial Policy is (almost) Always Bad Policy

Strain makes a case against the recent turn to policies that favor specific domestic industries, as most of these policy efforts have multiple, competing objectives and are unlikely to yield public benefits that exceed the public costs. Instead, to advance American innovation, the government should invest public funds in basic research and infrastructure. The goal of this investment should not be to create manufacturing jobs and should not target specific products or sectors, but should instead be focused on increasing innovation and dynamism more broadly, which will in turn increase productivity and wage growth. 

Suggested Citation: Strain, Michael R., 2024. “Protectionism is Failing and Wrongheaded: An Evaluation of the Post-2017 Shift toward Trade Wars and Industrial Policy” In Strengthening America’s Economic Dynamism, edited by Melissa S. Kearney and Luke Pardue. Washington, DC: Aspen Institute. https://doi.org/10.5281/zenodo.13974079.

The Widening Economic and Social Gaps Between Young Men and Women

Recent social and economic data has revealed a troubling trend: young men in the US are increasingly falling behind their female peers, a long-widening gap that has accelerated in the wake of COVID-19. Many young men have struggled to navigate the disruptions associated with the pandemic, resulting in stagnating labor force participation rates, declining college enrollment, and increased social isolation.

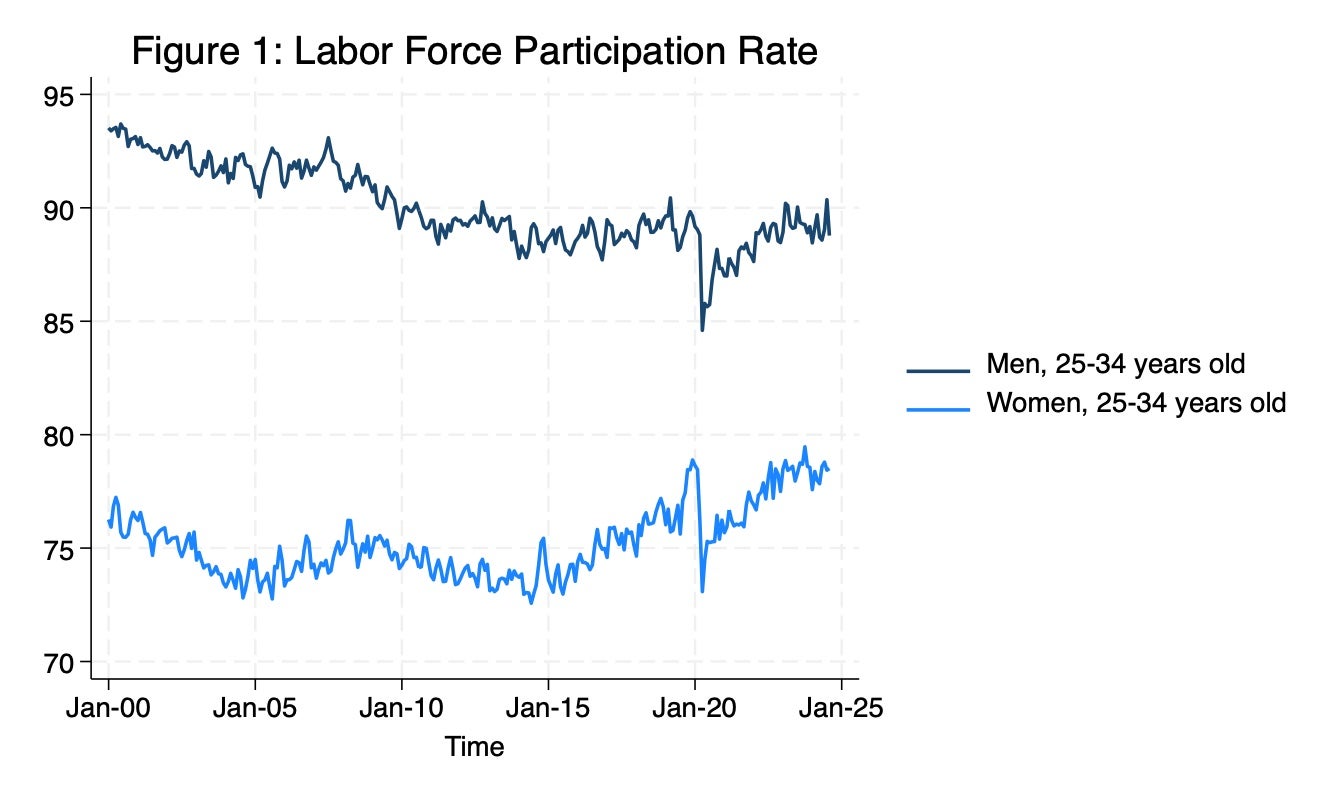
This phenomenon is part of a longer trend of young men’s declining labor force participation. As shown in Figure 1, the average share of men 25-34 years old employed or looking for work has dropped from 92.4 percent twenty years ago, in August 2004, to 88.8 percent in August 2024. If labor force participation among young men today matched its August 2004 rate, over 700,000 more men would be in the workforce. On the other hand, over that same time, women’s labor force participation has risen from 72.8% to 78.5%

The decrease in labor force attachment comes at the same time as a significant drop in college enrollment after the pandemic, a trend highlighted in a previous AESG In Brief. Among men who had just graduated high school, just 55% enrolled in college in 2021, down from 62% in 2019, while these rates remained at 70% across this period for women. The most recent data indicates that men’s college enrollment rates have not yet recovered from their post-pandemic drop.

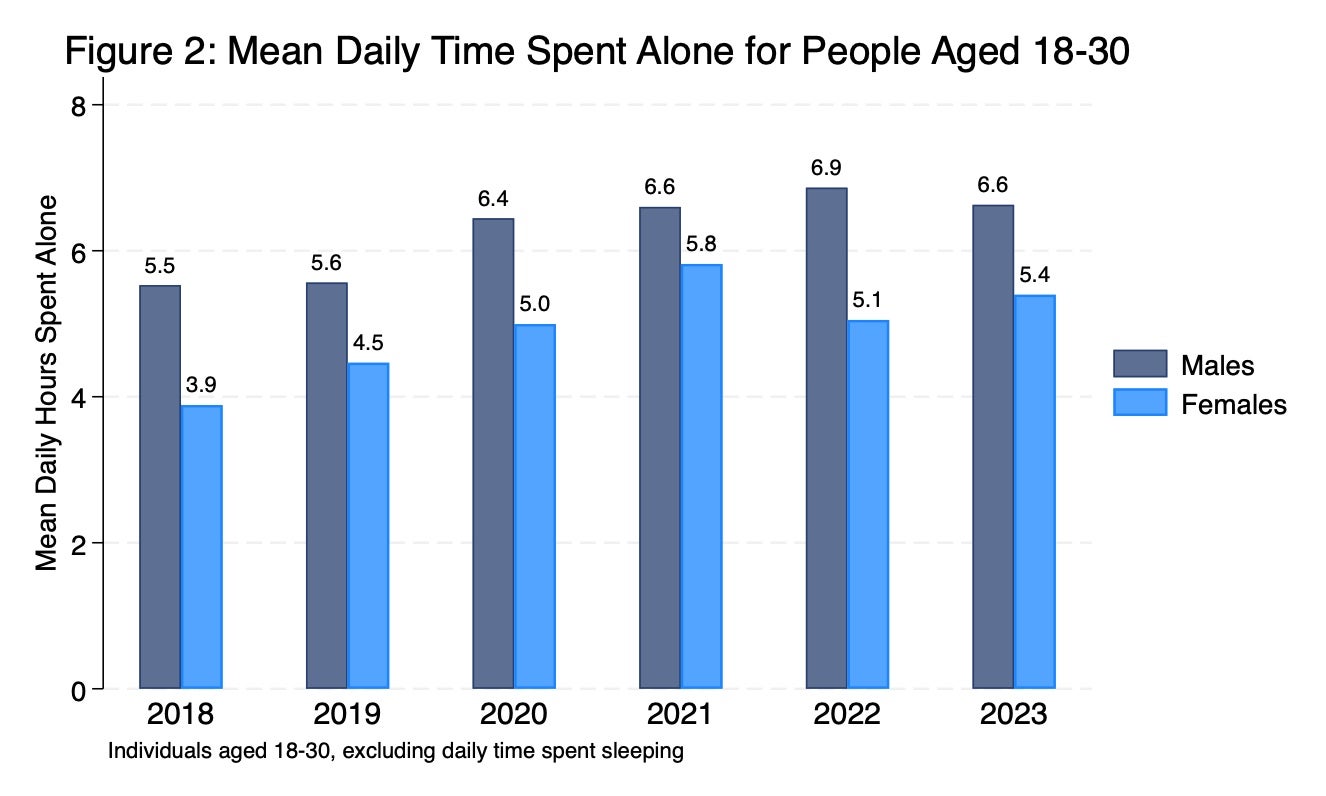
As young men are less likely to join the workforce or enroll in school, they are lives of increased isolation. As shown in Figure 2, men spend an average of 6.6 non-sleeping hours alone each day, compared to 5.4 hours for women. This represents an increase of over one hour spent alone daily compared to pre-pandemic figures. This increased isolation contributes to weakened labor market prospects through a narrowing of social networks.

The declines in young men’s academic progress and social connectedness experienced during the pandemic could spell further worsening in labor market outcomes. In their 2019 AESG paper A Policymakers Guide to Labor Force Participation, Keith Hennessey and Bruce Reed highlight that men with lower levels of education have experienced the largest declines in labor market prospects from 1965-2019, as technological disruptions and competition from low-wage overseas workers reduced economic opportunities for non-college educated men. Over that time, labor force participation among men with a high school degree but no college experience fell by 14 percentage points, compared to a 4 percentage point drop among men with a bachelor’s degree. 

Helping young men today overcome the acute, pandemic-related disruptions they experienced just as they entered adulthood will take significant and widespread investments. Such efforts include ensuring those who want to enter college after pandemic-related disruptions are able to do so, restoring pathways to economic security outside of the college pipeline, and equipping young men with the social and emotional support to navigate this period in their lives  – but these investments will be crucial to building a productive, economically secure next generation.

August 2024 Jobs Report: The Summer Slowdown Continues

The BLS estimated that the US economy added 142,000 jobs in August, and the unemployment rate ticked down slightly from 4.3% to 4.2%. This report is far from a worst-case-scenario many had feared, but does tell a consistent story of a labor market that is moving from a phase of post-pandemic normalization into outright weakness. 

1. Job growth has slowed sharply over the past quarter

Today’s data first demonstrated that the weakness in last month’s report was not a fluke. Indeed, the estimate for employment growth in July was revised down a further 25,000 to just 89,000 jobs added. Taken with the revision for June, total job growth over the past two months was 86,000 lower than previously estimated. Over the past three months, we have seen a substantial slowdown in job growth compared to even just the beginning of 2024: in January, the three-month moving average of employment growth was 243,000 – now that average sits at just 116,000. For reference, the US economy averaged 190,000 jobs added per month pre-pandemic (over 2015 to 2019).

2. The labor market weakening is broad-based, with many industries losing jobs

Second, over the past several months, labor market weakness has spread to more industries and the signs of growth are increasingly restricted to a small number of sectors. In August, just two industries, Health Care and Construction accounted for more than half (80,000) of the 142,000 net increase in jobs. Moreover, for the first time since the onset of the pandemic, more industries have shed jobs over the past three months than have increased employment (from the BLS Employment Diffusion Index).

3. Job losers are having a more difficult time finding jobs

One bright spot in today’s report was that the unemployment rate ticked down from 4.3% to 4.2%, but this drop was almost entirely because the idiosyncratic factor driving last month’s uptick (a weather-related increase in workers on temporary layoff) fell back to normal levels. More importantly, over the past three months an increasing number of people are moving into the ranks of the unemployed when they enter the labor force (rather than immediately finding a job) and when they permanently lose their job (rather than finding new work). The US has avoided a more severe slowdown in large part because, when workers have lost their job, they have had a relatively easy time finding new work – but that has become increasingly difficult in recent months.

What it Means

The slowdown in the top-line job growth numbers, the broad-based weakening across most sectors, and the flow of workers from job loss into unemployment are all signs that the job market is significantly weaker than even just a few months ago – and is skirting the line between normalization and deterioration. All eyes will now be on whether the Federal Reserve lowers interest rates by 25 or 50 basis points later this month. What happens at the September meeting is much less important than where interest rates ultimately end up over the longer-term, but the underlying weakness in today’s report boosts the case for an aggressive start to the Fed’s rate-cutting cycle.

July 2024 CPI Report: Trending Towards Two

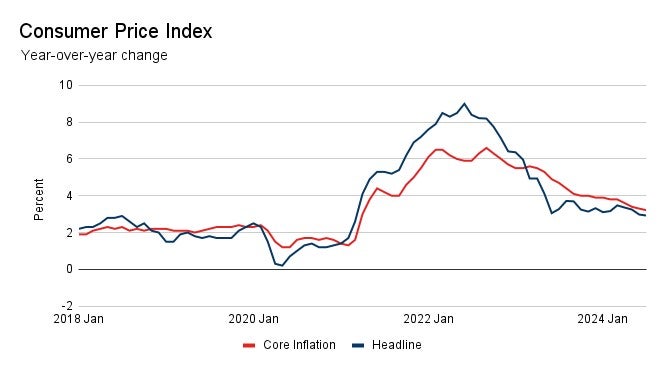
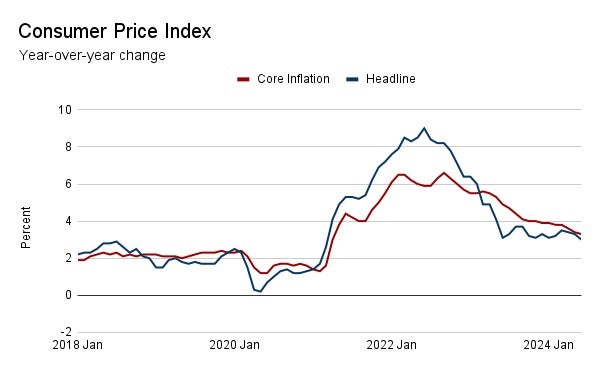
The steady cooldown in inflation that has marked much of 2024 continued in July. The Consumer Price Index rose at a 2.9% annual pace for all items, and at a 3.2% pace for all items excluding food and energy. These headline and core inflation rates are now at their lowest points since March 2021 and April 2021, respectively. Last month, the FOMC statement noted that members are looking for “greater confidence” that inflation is moving sustainably toward its 2% target before lowering interest rates, and the data in today’s CPI report should continue to build that confidence. 

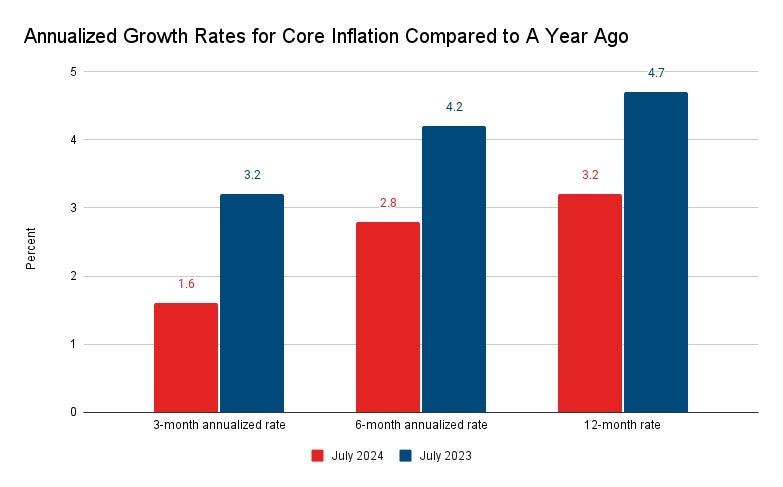
First, more encouraging than the top-line numbers for July are the indications of where inflation is headed. Although core inflation has risen by 3.2% over the past year – still above the Fed’s target – trends in the data over the past three and six months indicate that inflation will continue to fall: over the past six months, core inflation is trending at a 2.8% annual rate, and if we look at just the past three months, it has fallen to a 1.6% pace, below the Fed’s target. 

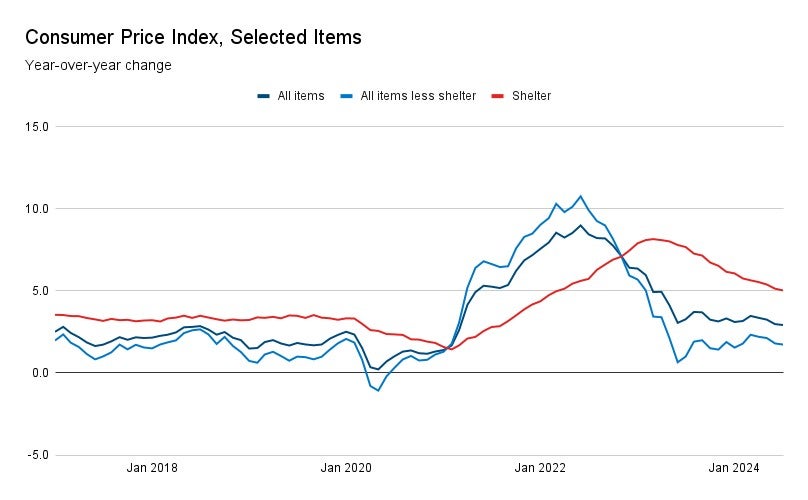
Second, rising housing costs are the largest contributor to price growth right now, and that too is slowly trending down. Shelter prices accounted for 90% of the overall price growth in July, and removing that category, headline inflation was just 1.7% over the past year. The positive news is that shelter inflation in the CPI has been continually falling since reaching a peak of 8% last year: price growth for shelter fell to 5.0% in July, the lowest level since March 2022, and has been trending at a 1.9% annual rate over the past three months.

Today’s inflation readings, along with recent employment data, paint the picture of an economy that has steadily cooled down throughout 2024. The pressures that contributed to high inflation over the past few years – including a tight labor market – have eased. Smaller job gains and rising unemployment have contributed to the slowdown in price growth, and those dynamics make it more likely that inflation will continue to fall sustainably towards 2%.

Rising Childlessness is Driving the Decline in Birth Rates in the United States

The United States has experienced a dramatic decline in birth rates, starting in 2007 and continuing through recent years. This post updates and expands on findings in Kearney, Levine, Pardue (2020), The Puzzle of Falling Birth Rates in the United States, which concludes that the decline in birth rates has been fueled more by a higher frequency of women having zero children than by women having smaller families. 

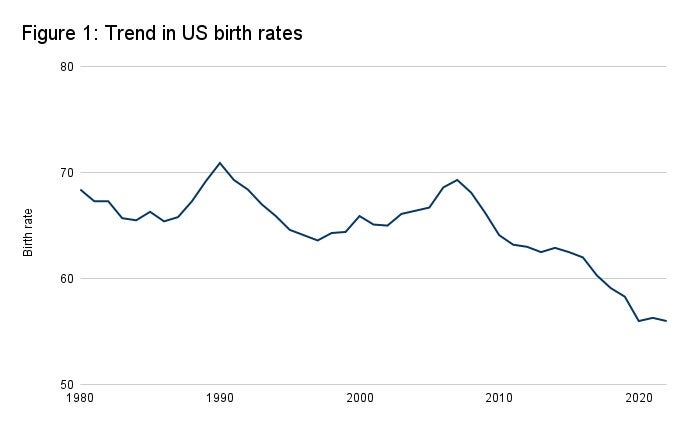
As shown in Figure 1, the overall birth rate in the US, defined as the total number of births per thousand women aged 15-44, has fallen from a recent high of 69.3 in 2007 to 56.0 in 2022. In recent years, the birth rate dropped from 58.3 births in 2019 to 56.0 in 2020 (a drop that Kearney and Levine (2021) contribute to COVID and that seems to be bigger for second births), before rebounding slightly to 56.3 in 2021 and ultimately returning to that multi-decade low of 56.0 in 2022. 


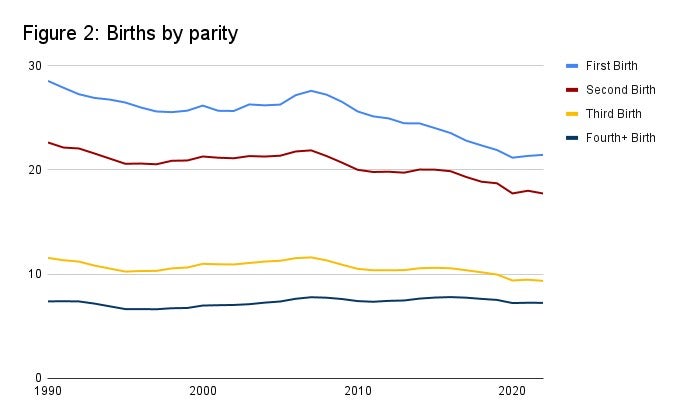
Figure 2 extends data in Kearney, Levine, Pardue (2020), charting birth rates by parity (birth order). From 2007 to 2022, first births declined from a rate of 27.6 per 1,000 women aged 15-44 to 21.5, a drop of 6.2 births. Second births declined from 21.9 to 17.7, a drop of 4.1 births. The birth rate for third-order declined by 2.3 from 11.6 to 9.3. Fourth or higher order births fell by 0.5 births. Although first, second, and third-order births declined by similar proportions (22%, 19%, and 20% drops, respectively), in absolute terms the drop of 6.2 first births can account for about half of the 13.3 total decline in birth rates over that period.

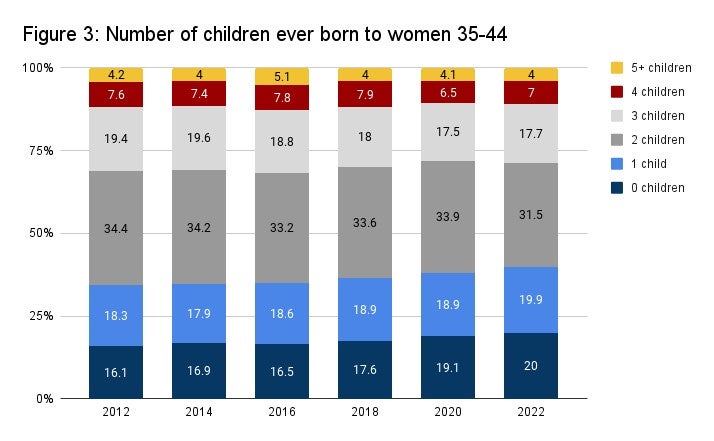
The rise of childlessness is also apparent in recent survey data. Figure 3 plots data from the Current Population Survey’s June Fertility Supplement. The share of women ages 35-44 reporting zero children ever born has risen from 16.1% in 2012 to 20% in 2022. Women reporting 1 or more children born rose 1.6 percentage points, and every other group (2 children, 3 children, 4 children, and 5 or more children) declined or were relatively flat over this period. Furthermore, the rise in women 35-44 reporting no children ever born is seen across nearly every demographic group – by family income, race and ethnicity, geography, and employment status.

Kearney, Levine, and Pardue (2020) find little evidence of a relationship between the decline in fertility and recent policy or economic changes over that period. This shift, instead, is likely a reflection of changing priorities of recent cohorts of US women, including life aspirations and preferences for having children.

Regardless of the cause, Kearney and Levine note in a 2020 AESG policy paper that these demographic trends pose a significant headwind to future economic growth. Should the drop in fertility continue, the US working-age population will decline within the next decade, leading to a smaller labor force and slower growth; second, an older workforce could drive lower innovation and productivity growth; finally, the imbalance between younger and older workers would further strain entitlement programs, such as Social Security and Medicare, which rely on taxes paid by current workers to fund benefits for older retirees.

June 2024 CPI Report: The Summer Cooldown Continues

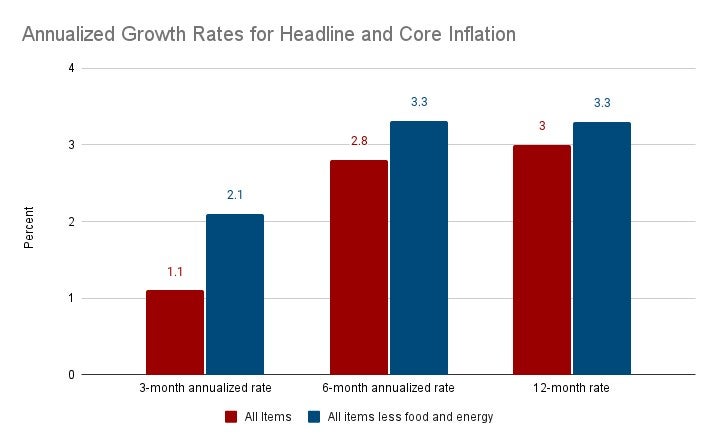
The Consumer Price Index rose at a 3.0% annual pace in June 2024, and 3.2% for all items excluding food and energy. Three things stood out from this report.

1. Core CPI Hits Lowest Level in Three Years

While markets expected a small increase in prices from May to June, the Consumer Price Index declined by -0.1%, and over the past year prices have risen by 3.0%. Among items in the core CPI, which excludes food and energy, prices rose by 0.2% since last month and by 3.3% over the past year. The 3.3% increase in the Core CPI is the smallest gain since April 2021.

2. Recent Trends Paint a More Encouraging Picture

After inflation started this year much hotter than expected, prices in recent months have been falling steadily, and more frequent measures of inflation trends reflect this progress. Headline inflation fell to 3% in June, from a recent high of 3.5% in March. If price trends in the three months since March continue for 12 months, annual inflation would hit 1.1% – far below the Fed’s 2% inflation target. Core inflation, which is a more reliable indicator of underlying trends, shows similar progress: the past three months show annual inflation is trending just near target at 2.1%.

3. Declining Prices Have Been Broad-Based

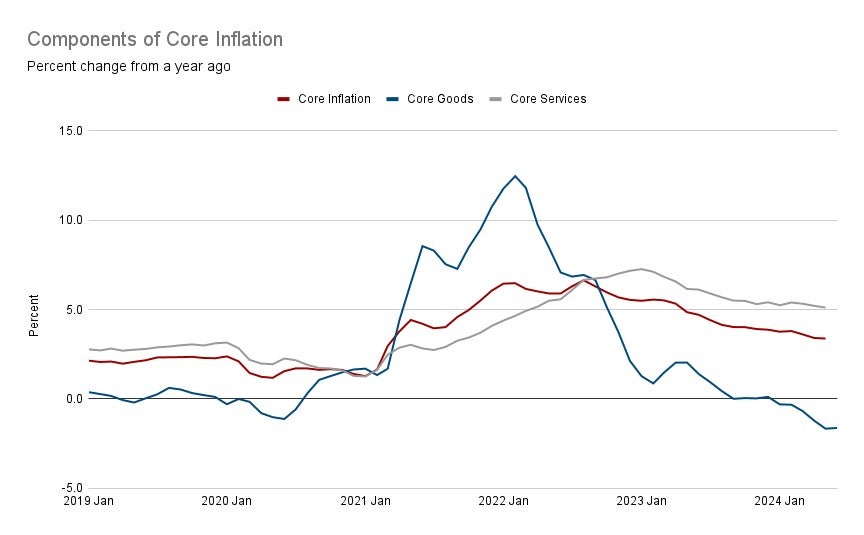
One of the most encouraging signs in today’s report was the decline across several groups within the Core CPI, suggesting this data represents the start of a sustained fall in inflation rather than a one-month blop. Within core goods, prices for used cars continue to fall, dropping by 1.5% since last month. WIthin services, airfare prices registered a 5% drop.Most notably, shelter prices rose by just 0.2% over the last month, the smallest increase in that category since August 2021. 

What this means:

The June employment report indicated that the labor market is entering a new period of slower growth, and the inflation report for that month should lead to the same conclusion about prices. It has become clear by now that the uptick in inflation at the beginning of the year was more noise than signal, and data since March has shown prices getting back on their disinflationary track. Core inflation is now at its lowest level in three years and, if the last three months are an indication, is sitting right now just at the Fed’s target. Taking these inflation trends together with the slower pace of job growth and rising unemployment, the question now becomes whether this summer cooldown turns into a fall chill.

June 2024 Jobs Report: Entering a New Phase of the Job Market

The BLS estimated that the US economy added 206,000 jobs in June, with the unemployment rate ticking up from 4.0% to 4.1%. Three things stood out beneath the headlines of this report.

1. Revisions to April and May Show a Softer Job Market

While the topline number of 206,000 jobs added in June was about in line with market expectations, the biggest signal in today’s report were the revisions of job growth in April and May. After today’ report, employment growth over those past two months was revised down by a combined 111,000 jobs. Accounting for June’s data and those prior revisions, the three-month average of job gains now stands at 177,000 jobs, the lowest this measure has reached since January 2021.

2. Unemployment Rate Has Started to Steadily Tick Up

As monthly job gains have slowed, the share of workers looking for work but unable to find it has consistently risen in recent months. The path of the unemployment rate can be characterized in two general period since coming down after the pandemic: for 12 months starting in April 2022, the unemployment rate held steady between 3.4% and 3.6%; for the next year it stayed between 3.7% and 3.9%, over the past two months it has ticked up to 4% and now 4.1%. That’s the highest level since November 2021, another indication that the job market has reached a new, cooler period.

3. Wage Growth Reaches Post-Pandemic Low

Last month’s data featured strong job gains and an uptick in wage growth. Along with the downward revisions to job growth, the earnings data in today’s report shows a return to the gradual cooldown in wage pressures. Indeed, among all employees, average hourly earnings grew by 3.86% over the past year, the lowest rate of growth in the post-pandemic recovery period.

What this means:

Nearly all major data points in today’s employment report indicate we are entering a new phase of the job market. At the start of this year, the labor market looked surprisingly resilient, but the slower job growth, higher unemployment, and moderate wage gains seen in June all point to a labor market that is now quite close to a healthy “normal.” This softening, taken together with the significant cooldown in inflation over the past two months, should set policy makers up to start bringing down interest rates later this year.

May 2024 CPI Report: Can the US Economy Have it All?

The Consumer Price Index rose at a 3.3% annual pace in May 2024, and 3.4% for all items excluding food and energy. Three things stood out from this report.

1. Inflation Softens More Than Expected

Overall, consumer prices were unchanged from April to May and rose by 3.3% over the past year. Core CPI, excluding volatile goods and energy prices, rose by 3.4%, the lowest level since April. Forecasters were expecting the total CPI to rise by 3.4%, but falling gas prices, which dipped by 3.6% over the past month, helped to push the price index down.

2. Housing Costs Keep Inflation Elevated

Declining gas prices helped to tamp down inflation in May, but still-rising housing costs are preventing a faster decline in the price index. Housing costs have been very slow to come down from their post-pandemic high, with the shelter component of the CPI rising by 5.4% since last May. Shelter makes up 36% of the total CPI, and high costs have played a large role in keeping inflation elevated. In May, shelter costs alone accounted for 57% of the rise in all prices over the past year.


3. Core Inflation Hits a Three-Year Low 

The 3.4% increase in prices outside of food and energy was the slowest pace in over three years. This core index is considered a reliable indicator of underlying trends in overall inflation, and May’s data marks the continuation of a slow but steady descent – this time last year, core prices were rising by 5.3%. Indeed, by more recent measures, core inflation is set for further improvements. Looking at the past three months, core inflation is trending at a 3.2% annual rate, and the annualized pace of this past month’s change is 2.4%.

What this means:

The May employment report’s larger-than-expected job growth and wage gains opened the question of how hot the US economy continues to run – and whether interest rate cuts amid such solid data are appropriate. But today’s CPI data send a strong signal that this economy can manage both strong job growth and falling inflation at the same time. While no single report should alter the outlook too much, May’s data should make policymakers much more confident inflation continues on the path back to their 2% target.